It’s been a week since Bitcoin (BTC) smashed its previous all-time high (ATH) price, and the crypto market has not remained the same. Altcoins have surged, and there is also a memecoin mania that is taking the market by storm. So, good times, right?
Jupiter (JUP), the leading DEX platform, has exceeded its TVL and transaction volume. Raydium (RAY) has surged by 22% and has hit a new yearly high of $6.3. Quant (QNT) has had a 28% price rise and 523% increase in trading volume and Sandbox (SAND) has had a 20.49% price increase and a 480.65% surge in trading volume.
Now, let us take a more in-depth and critical look at some of the most essential events happening in the crypto market.
Jupiter surpasses $2B TVL
Jupiter (JUP), a prominent DEX (decentralized exchange) platform, has marked a significant milestone, as its TVL (total value locked) exceeds $2 billion. The trading platform’s total transaction volume has surpassed $374 billion, proving its high standing, adoption, and usage in the DeFi (decentralized finance) ecosystem.
In addition, JUP’s price increased by 10.09% to $1.24 at press time, while its 24-hour trading volume soared by 196.50% to $443.68 million. Hence, this momentum has attracted traders, investors, and analysts.
JUP has bullish momentum
Jupiter (JUP) is currently bullish, and multiple signals indicate this.
For one, the liquidation corroborates JUP’s rally. Over the past 24 hours, long liquidations hit $715,680, while short liquidations amounted to $271,310. This inequality reveals dominant upward pressure as liquidated shorts added buying momentum to the crypto market.

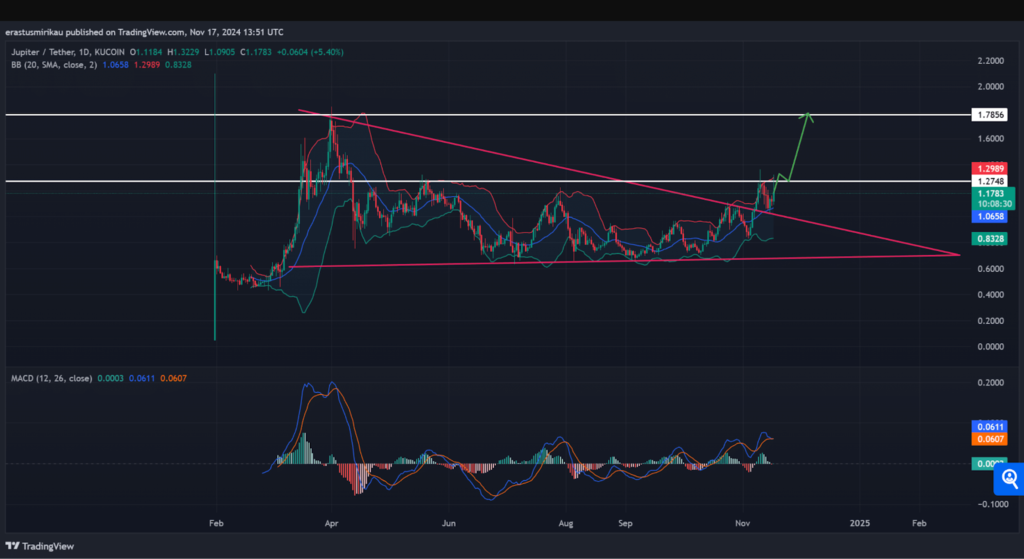
Secondly, technical analysis supports bullish, solid sentiment. JUP’s price has broken out of a descending triangle, indicating strong bullish sentiment. After touching an intraday high of $1.3229, the price settled at $1.24, retaining its upward movement.
The Bollinger Bands (BB) show increasing volatility, with JUP’s price penetrating the upper band, indicating intense buying activity. Also, the Relative Strength Index (RSI) has hit 70, showing intense buying pressure but warning that the asset might be overbought in the short term.
Furthermore, the MACD indicator supports the bullish sentiment, as the momentum line has crossed above the signal line. To that end, JUP seems ready for additional upside, with the following notable resistance at $1.786.
Yet, short-term retracements can’t be ignored based on the overbought conditions.
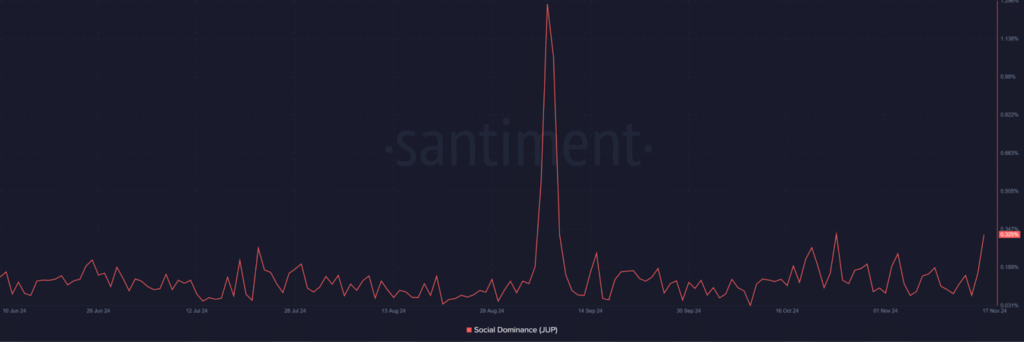
Third, JUP’s rising value is not simply the only indicator of its recent triumph. Its social dominance doubled from 0.166% to 0.329% within a day – proof of an upsurge in online conversations and community engagement.
There is no gain in saying that an increase in social interest typically leads to speculation, positive sentiment, boosted retail benefits, and price action. But overall, JUP’s heightened visibility indicates rising confidence in its utility and probable demand.
What is next for JUP?
Jupiter (JUP) is quickly becoming one of the most in-demand tokens in the market.
Its rising TVL, record-breaking transaction volume, heightened social dominance, and price rally are proof of its growing adoption. With positive on-chain activity and bullish technical indicators, JUP seems well-positioned for additional growth.
Although short-term caution is needed due to overbought signals, its breakout above crucial resistance implies consistent upward potential. Jupiter’s rally is a statement of intent defining a leading position in the DeFi space.
Raydium surges by 22%
Raydium (RAY) surged by 22% over the weekend, reaching a new yearly high of $6.3. Yet, according to analysts, there is still the possibility of additional growth for the token.
Fueled by the memecoin mania, the Solana ecosystem felt the weekend pump. Still, SOL only had a 10% daily rally compared to RAY’s 22%. As the memecoin dominance continues, will this signal a further rally for RAY?
Raydium’s incredible DEX growth
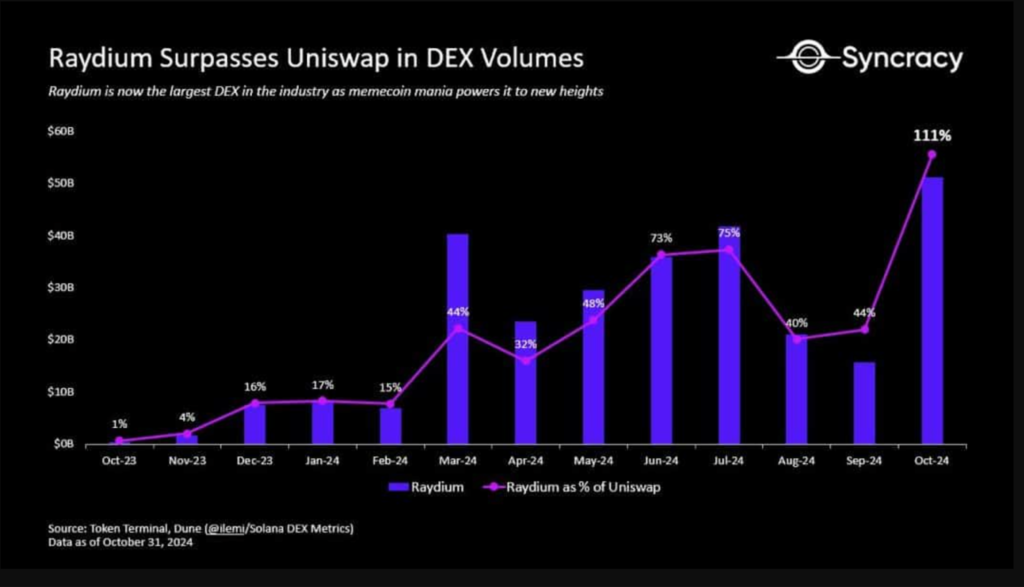
Nothing explains Raydium’s (RAY) success clearer than from a fundamental point of view. Thus, this puts Raydium in a favorable position against rivals like Uniswap (UNI), which it surpassed in DEX (decentralized exchange) volume last month.
Ryan Watkins, the co-founder of crypto VC Syncracy Capital, remarked that Raydium was at the heart of DEX, hitting 20% share of global exchange volume. He posted on X,
“Raydium is now the number 1 DEX in the cryptocurrency by volume. It also leads DEXs to their highest share of global exchange volumes ever (20%). Memecoin mania = Raydium’s piggy bank.”
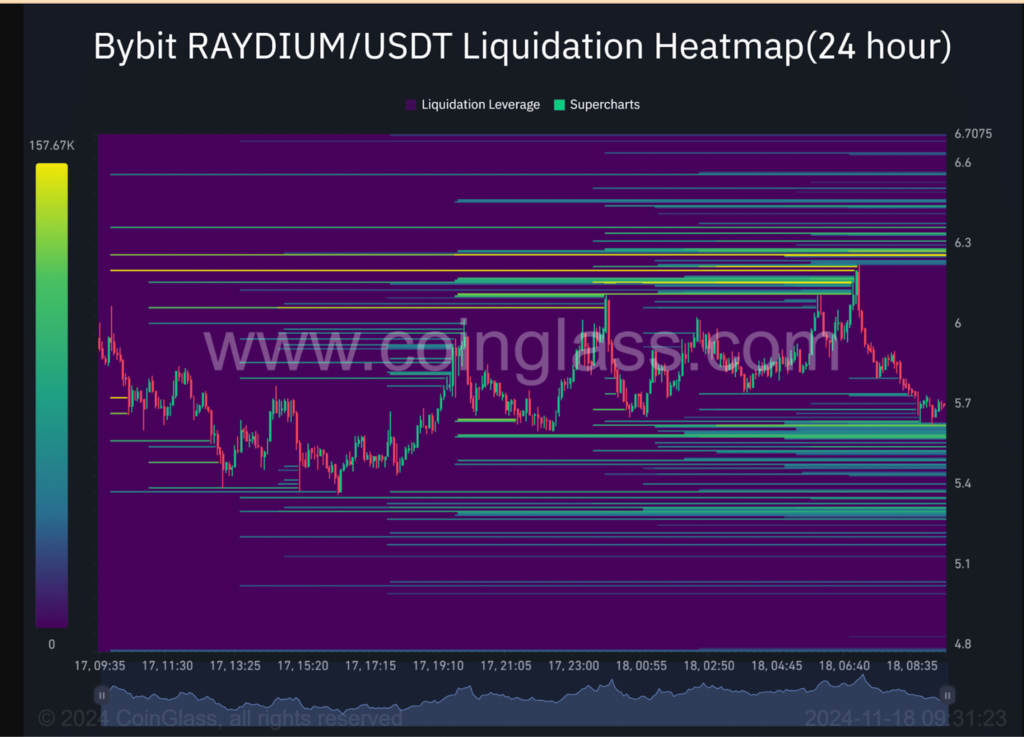
Even at that, RAY cooled off a bit at press time, an action that market makers may have initiated to get liquidity below $5.7. The subsequent nearest liquidity was at $6.3, an upside target that could keep RAY above $5 and drive it higher. Yet, a break below $5 could delay the move to $10.
Where does RAY go from here?
After August’s recovery, RAY has pumped more than 350% from $1.2 to over $5. Still, some technical indicators indicate a significant move above the $5 level could prepare the token for increased targets.
One is from the weekly candlestick as it closed above $5, which doubled as a bearish order block (OB, cyan) formed two years ago. This meant that RAY could work towards $7, $8, or $10 bullish targets if the uptrend momentum persists.
Another is the buy sentiment as viewed on Trading View.

Overall, Raydium’s surge reflects a bullish sentiment backed by robust fundamentals, though market analysts are wary of its sustainability amid volatile market conditions.
Quant rises by 28%
Quant (QNT) is the talk of the town after its impressive 28% price increase, reaching $83.76 at press time. This surge came with a tremendous 523% increase in trading volume, expanding its market cap to more than $1.01 billion.
Amidst unstable trends in crypto markets, QNT’s price action gained momentum. This leads one to wonder if this breakout signals the beginning of a sustained bull run.
What is behind Quant’s rise?
Quant’s (QNT) breakout from a lengthy descending wedge pattern showed a possible shift in market sentiment.
Typically, such breakouts have marked the beginning of bullish trends, and QNT seemed to be following suit. Yet, the critical resistance at $103.20 loomed ahead.
Breaking beyond this level could lead to stronger buying momentum, while rejection may lead to a retest of lower support levels near $70. Some technical indicators signal this positive sentiment.
First, the stochastic RSI was 85.63 at press time, firmly in overbought territory. This revealed intense buying activity but also presented the possibility of short-term corrections.
Secondly, the moving average (MA) cross at $69.50 and $63.80 established bullish momentum, as the shorter-term MA (9-day) has crossed above the longer-term MA (21-day).
Also, on-chain metrics further underscored QNT’s strong position. Large transactions increased by 8.90%, and net network growth rose by 0.62%, indicating increased adoption and activity among major holders.
Besides, 1.42% of QNT wallets were now “in the money,” reflecting elevated probability. While concentration among top holders has reduced slightly (-0.23%), the wider sentiment mainly remained bullish.
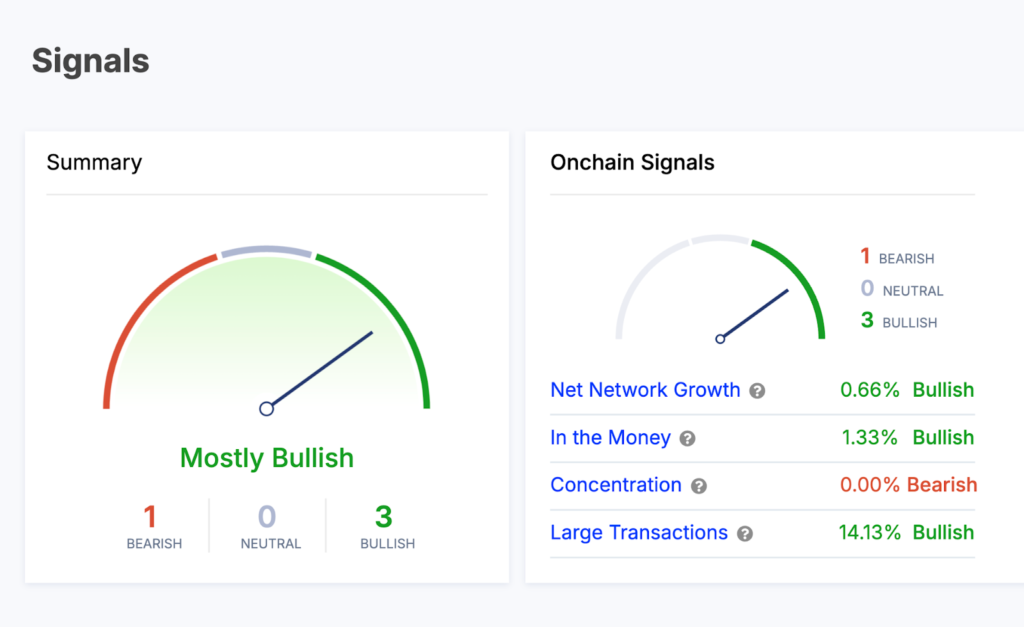
Beyond the strong momentum these metrics emphasize, it is vital to tread carefully after such rapid profits.
What is next for Quant?
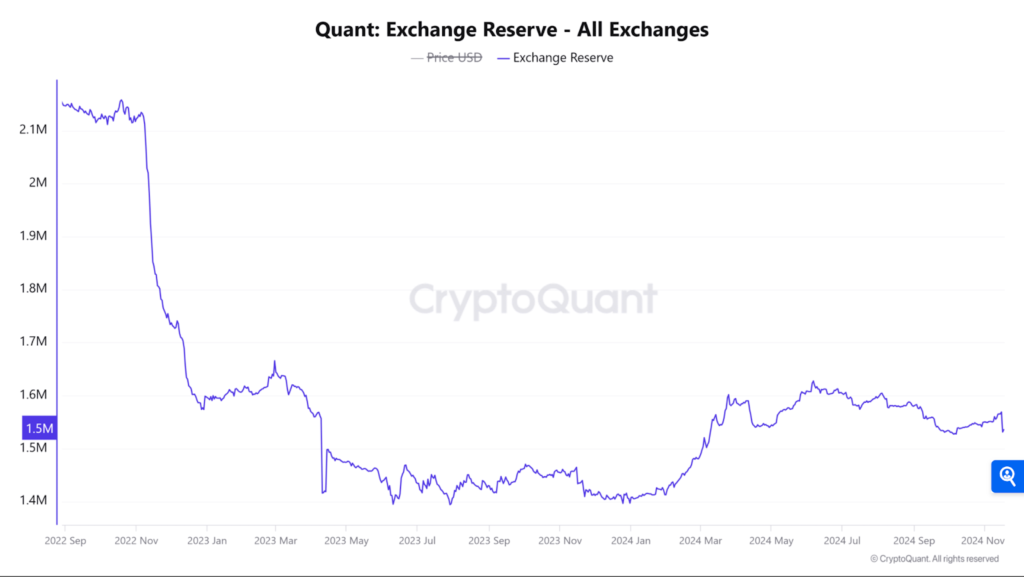
Quant’s exchange reserves have decreased by 2.27% over the last 24 hours, reaching 1.5357 million tokens at press time. Reduced availability on crypto exchanges usually signifies lower selling pressure and growing investor confidence.
Thus, with less QNT accessible for immediate sale, the probability for upward price movement becomes greater. This is on the condition that demand continues to be robust.
Quant’s breakout above its descending wedge, alongside a 28% surge and a 523% increase in trading volume, indicated strong bullish momentum. Still, the resistance at $103.20 remained a critical barrier.
So, if QNT can break above this level in the coming days, it will probably confirm a broader bullish reversal and possibly lead to additional profits.
SAND price increases by 20.49%
Sandbox (SAND) has increased by 20.49%, reaching $0.3629. Also, SAND’s trading volume surged massively by 480.65%, reaching $666.26 million in just 24 hours.
At press time, SAND was retesting the critical $0.36 resistance. This has led to questions about if the bullish momentum can be sustained or if a pullback might occur.
Will SAND continue its bullish momentum?
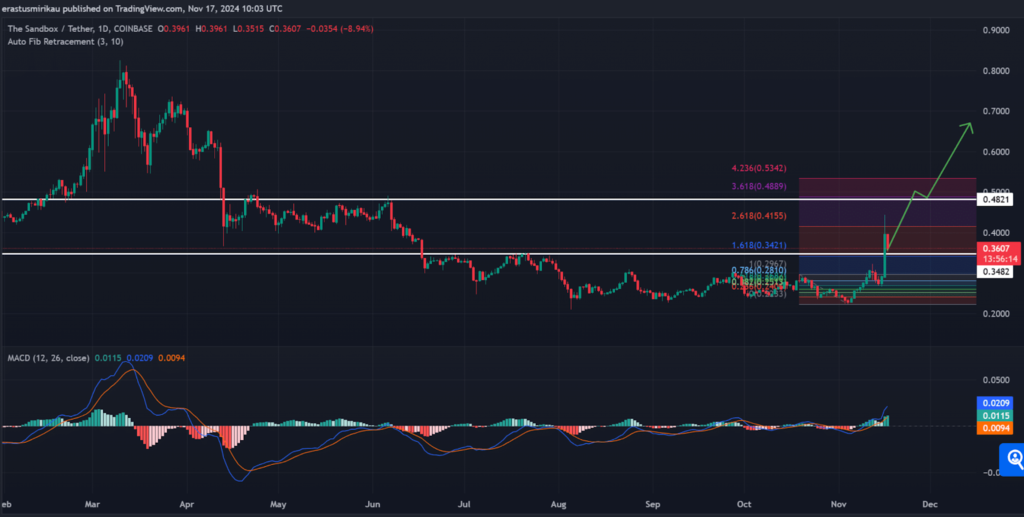
SAND’s price movement showed remarkable resilience as it tested $0.36, a vital resistance level that has formerly capped upward movements.
Yet, breaking above this threshold could unlock higher targets, mostly at $0.42 and $0.48, as shown by Fibonacci retracement levels. Conversely, rejection at this level may lead to short-term price corrections before any further upward trajectory.
In other news, trading indicators like the MACD are on bullish sentiment. This means that buying pressure has been sustained. In addition, SAND’s position near the 1.618 Fibonacci level ($0.34) buttressed the need for the $0.36 level as a make-or-break point for the token.
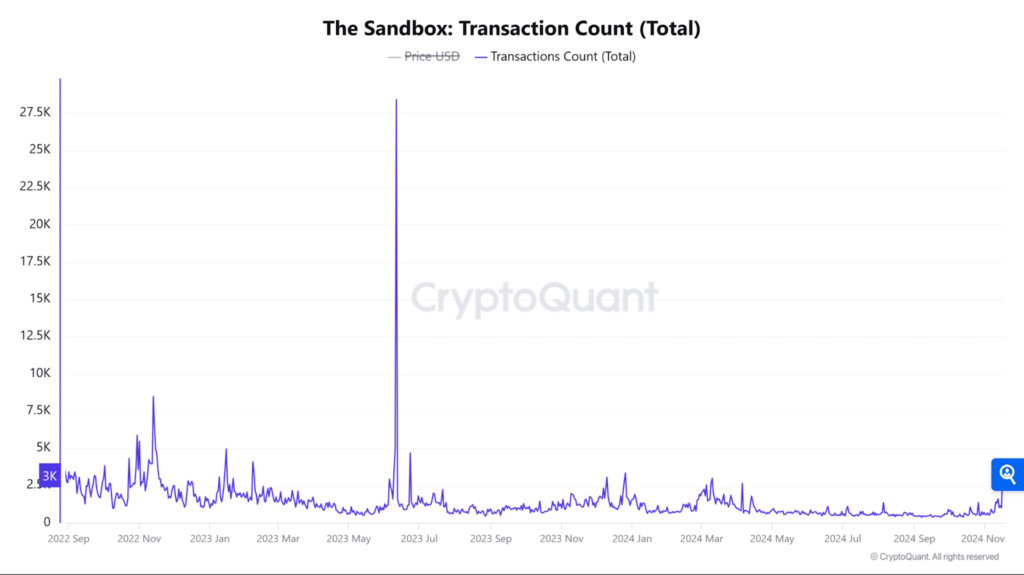
Also, on-chain metrics for SAND have kept exhibiting favorable growth signs. For one, active addresses increased by 2.42%, showing developing interest among market players. Then, transaction counts rose by 3.44%, reaching 3,720 over the same period.
These data points emphasized increased activity within the ecosystem, which could further stimulate SAND’s bullish momentum. Thus, rising network engagement has coincided with the token’s recent price increase.
What is next for SAND?
Firstly, exchange reserves for SAND decreased negligibly by 0.17%, with 575.59 million tokens now held on crypto exchanges. This points to reduced selling pressure and indicates accumulation by long-term holders.
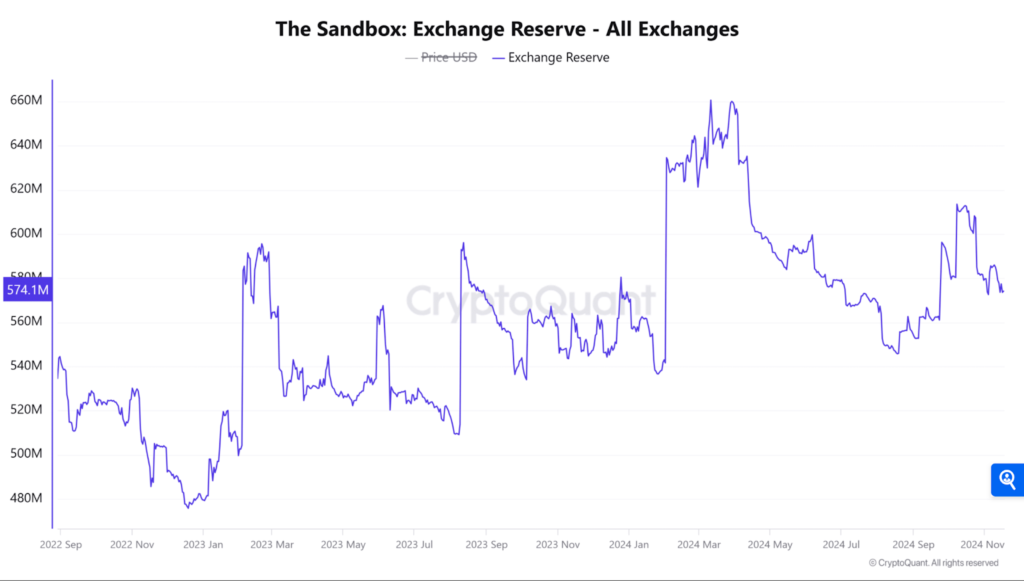
Assuming this trend persists, it could deliver a steady foundation for consistent price growth as circulating supply increases.
Secondly, there was an impressive 54.89% increase in Open Interest, which brings the total to $72.83 million. This mirrors amplified speculation from SAND enthusiasts and traders setting themselves up for substantial price movements.

It is also important to note that while this surge in Open Interest can heighten upward momentum, it also increases the possibility of volatility based on market sentiment.
By and large, SAND’s 20.49% increase – reinforced by strong technical indicators and positive on-chain metrics – places it well for a possible breakout. Yet, the $0.36 resistance level remains a crucial barrier.
So, a successful breakout could see SAND go for $0.42 and more, while a rejection may activate a short-term correction. At the moment, the bullish momentum seems to dominate.
Closing Remark
The global crypto market is currently on an upward trajectory. Its market cap has steadily risen to $3.12T, and its volume has also increased to $180.71B. Then, there is also Bitcoin who will, at this rate, get to $100K sooner rather than later.
Jupiter is setting the standard with massive gains for its TVL and total transaction volume. The DEX is unequivocally proving its mettle in the DeFi space. Raydium’s (RAY) surge over the weekend – above even Solana (SOL) – has firmly put it in the major conversations DEX. At least according to Syncracy Capital’s Ryan Watkins.
Quant’s (QNT) impressive increase in price and trading volume has left many to wonder if this signals the beginning of a sustained bull run. With positive on-chain signals and bullish momentum, it is hard not to be optimistic. The same can be said for Sandbox (SAND) as its bullish momentum continues in the ascendancy.
Zypto is committed to offering the best and most secure crypto services. On the business side, Zypto actively supports all forms and sizes of businesses to join the blockchain ecosystem. Here are just some of the crypto payments products and services available:
- Crypto Payment Gateway
- White Label Crypto Solutions
- Crypto Custody Servicess
- White Label Crypto Cards
- Custom Development
Zypto has also recently partnered with the Algorand Foundation to implement the use of ALGO as a payment method across the Zypto ecosystem. Find out more here.
What are your thoughts on this week’s crypto news? Did any particular development stand out for you? Leave a comment below and let us know your perspective.

FAQs
What does Jupiter surpassing $2B TVL mean for the DeFi ecosystem?
Alongside bullish Jupiter (JUP) trading signals, sentiments, and social dominance, this milestone is proof of JUP’s high standing, adoption, and usage in the DeFi ecosystem.
What are the signals of a bullish sentiment for JUP?
The bullish signals for Jupiter (JUP) include long and short liquidations, positive technical analysis (Bollinger Bands and MACD indicator), and increased social dominance.
What is behind Radium’s rise?
Fueled by the memecoin mania, Radium (RAY), the Solana token surged by 22%.
Does Quant’s surge signal a sustained bull run?
Quant’s (QNT) 28% surge came with a 523% increase in trading volume and expansion in its market cap. However, it is vital to tread carefully after such rapid profits.
Will SAND continue its bullish momentum?
After a price and trading volume surge, SAND’s price movement has shown remarkable resilience. Due to solid technical indicators and positive on-chain metrics, SAND appears bullish.








0 Comments