

This week, we analyze Bitcoin’s latest price movement and possible future trajectory. Similarly, we outline analyst’s predictions with SOL ETF approval on the horizon. Also, Ethereum’s MACD signals a bullish crossover as BNB’s TVL surges by $665M.
Come along.
What next for Bitcoin now?
On February 16, for the first time in two weeks, Bitcoin (BTC) gained consecutively for two days. As of then, it increased by 1% to $97,640, which extended the crypto’s bullish outlook on the weekly charts.
Conversely, CryptoQuant data also pointed out that BTC reserves on spot exchanges have dropped to their lowest levels in recent years. Exchange reserves increased between 2020 and 2022 but have declined since.
Investors keep withdrawing BTC from exchanges and moving it to cold storage, backing a long-term holding trend. A reduced exchange supply reduces the amount of bitcoins available for trading, which could increase price pressure if demand remains robust.
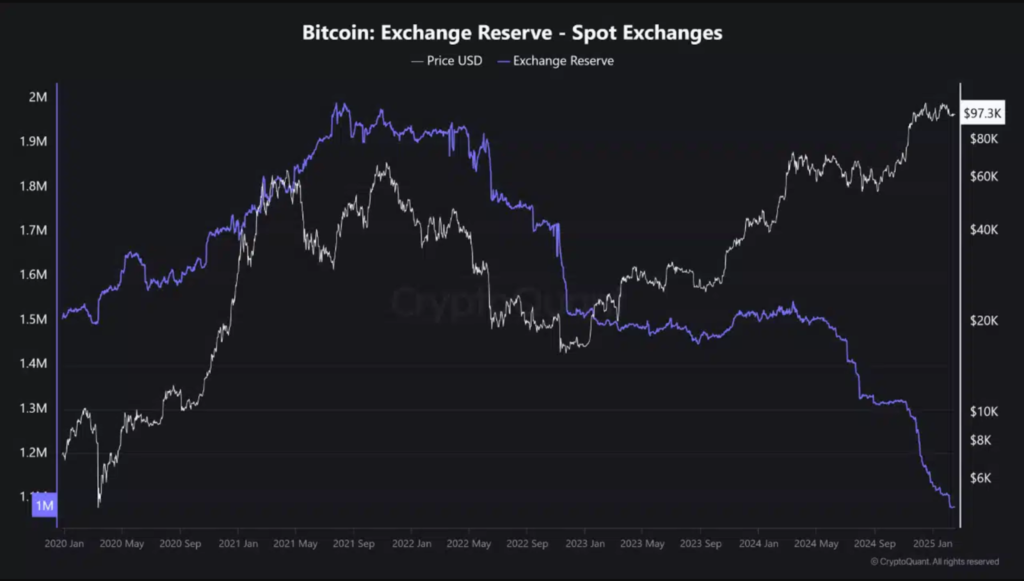
With Bitcoin showing an upward trend in 2024 and 2025, this shift indicates a tightening supply-demand balance. The ongoing reserve decline has raised speculation about a possible supply shock, as less BTC on exchanges may lead to price surges similar to past cycles.
Although BTC keeps trading sideways, some stakeholders don’t seem bothered.
What are analysts saying?
Firstly, CryptoQuant’s Frost expressed optimism that investor confidence remains high in the market. Frost noted that lasting market conditions indicate Bitcoin investors still expect the crypto’s price to recover.
He remarked that while a high confidence index usually occurs in a bull market, once it approaches 1, a market top ensues. At the time of writing, the confidence index was around 0.75.
On the other hand, when these indicators drop to almost zero, it always indicates a possible market bottom. At the time of writing, the index was nearing that threshold, indicating that possible long-term accumulation may be near.

Secondly, MicroStrategy’s Michael Saylor advocates for BTC as a long-term investment. According to his post, buying Bitcoin strengthened the network, while selling it weakened it.
Historically, surges in buying and selling have shaped Bitcoin’s trajectory.
An example was Tesla’s $1.5 billion BTC purchase in early 2021, which led to a rapid price surge. Conversely, heavy sell-offs by miners in 2014 led to a significant decline below $200.
Recently, Bitcoin has faced both buying and selling pressure. Market sentiment has fluctuated amid regulatory concerns, institutional accumulation and macroeconomic indecision.
What do on-chain metrics say?
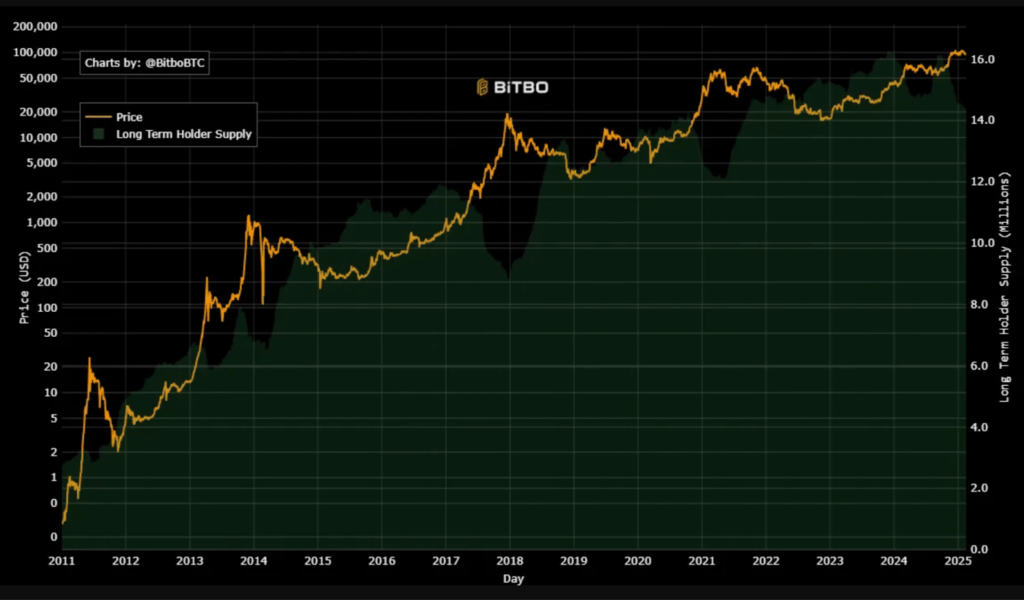
Bitcoin’s long-term holder’s (LTHs) supply has continued to rise, indicating strong confidence among LTHs. As it grows, it implies that long-term holders are not selling their BTC, which means strong market confidence.
Also, Bitcoin’s NUPL has remained within the belief/denial grade, indicating increasing investor positive sentiments. This is because most holders are in profit and still trust the rally.
Historically, BTC has surged whenever the NUPL has been at this level. In 2021, for example, Bitcoin’s NUPL hit 0.75%, valued at $64k for the first time. Thus, Bitcoin’s return on investment is still quite attractive to investors.
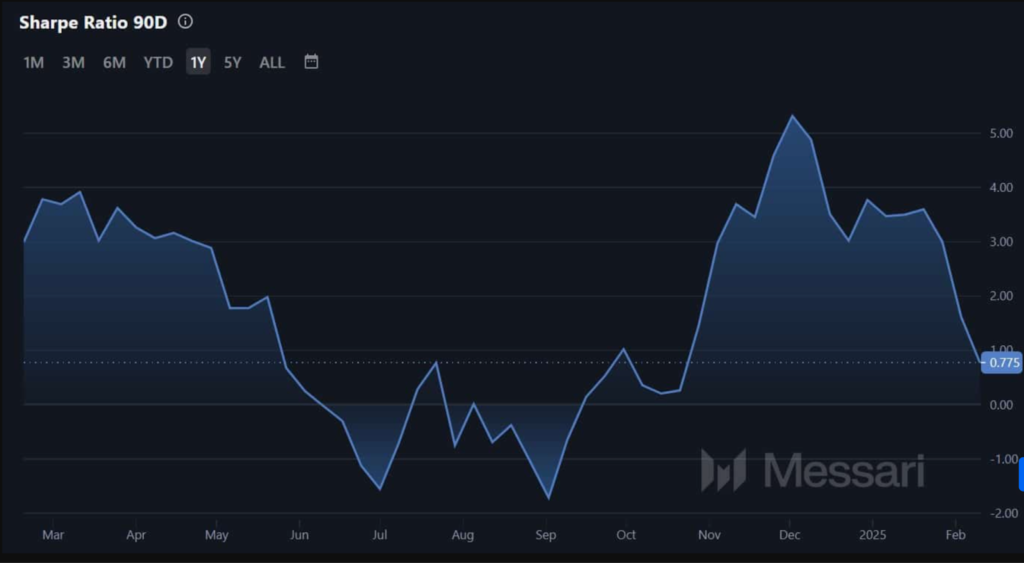
Take the long-term Sharpe ratio, which turned positive, for instance. This implies that the risk of investing in BTC is lower than that of traditional assets. With a value of 0.775, the Sharpe ratio suggested that investors may be highly confident about BTC’s market returns.
That being said, Bitcoin is still supported by strong investor confidence. With long-term holders still bullish, BTC may be well-positioned for more growth. If current conditions hold, we could see the cryptocurrency reclaim $99,436 and attempt $100k once more. Yet, with intense volatility in the market, a pullback wouldn’t be startling.
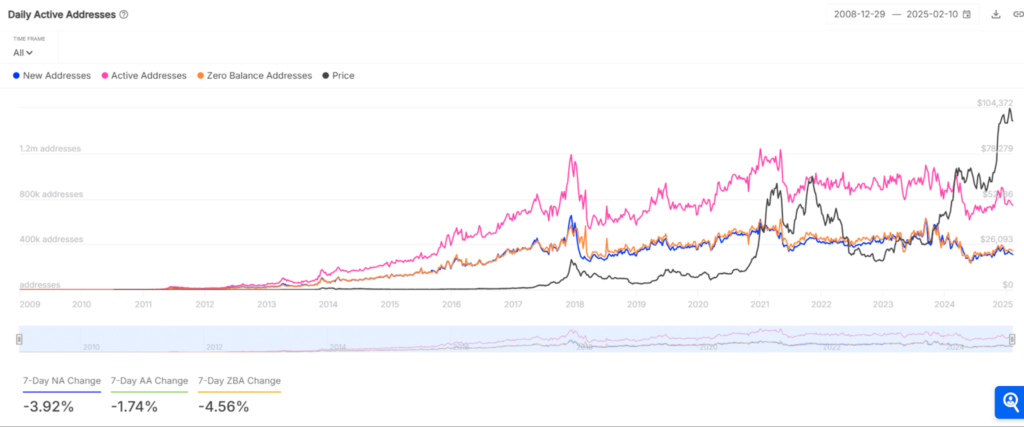
Furthermore, on-chain data displays a decline in new, active, and zero-balance addresses, with drops of -3.92%, -1.74%, and -4.56%, respectively, over the week.
This drop-off implies a cooling-off phase in network activity. However, it does not necessarily signal bearish sentiment, as such declines usually precede strong price movements.
Furthermore, Bitcoin’s historical price surges have often followed periods of reduced address growth, as accumulation begins before the next wave of new users. Thus, if new addresses increase again, BTC could enjoy a capital inflow.
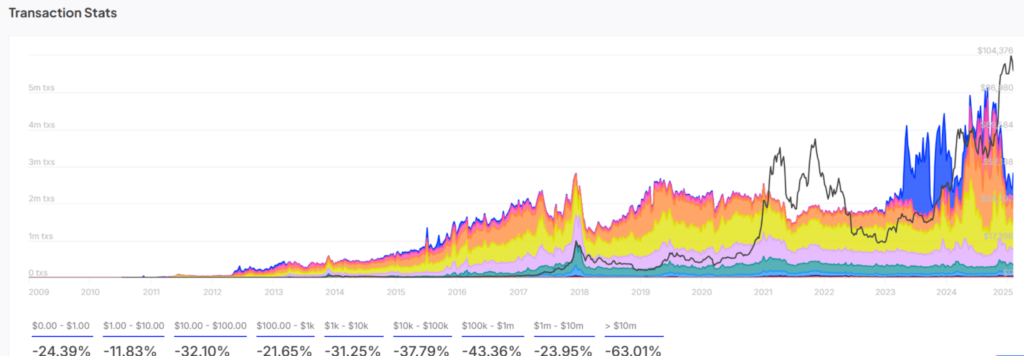
Finally, transaction statistics revealed a mixed outlook. Large transfers (>$10M) declined 63.01%, while mid-sized transactions ($100K—$1M) dropped 43.36%. Even smaller transactions under $1K witnessed massive reductions, further backing the decline in activity.
Yet, reduced whale transactions suggest a stabilization phase before the next principal price movement. Typically, such slowdowns have preceded either a decisive accumulation phase or a short-term retracement.
Ethereum’s MACD signals bullish crossover
An analysis of Ethereum’s In/Out of the Money metric revealed that ETH has held above the critical demand zone between $2,380 and $2,460. This zone represents a significant accumulation area, with approximately 2.47 million addresses buying 5.87 million ETH.
The absence of significant out-of-money positions above the press time price of $2,711.75 indicated minimal resistance ahead. At the time of writing, 85.8% of the positions were in the money, a sign of strong holder profitability that could hamper selling pressure.
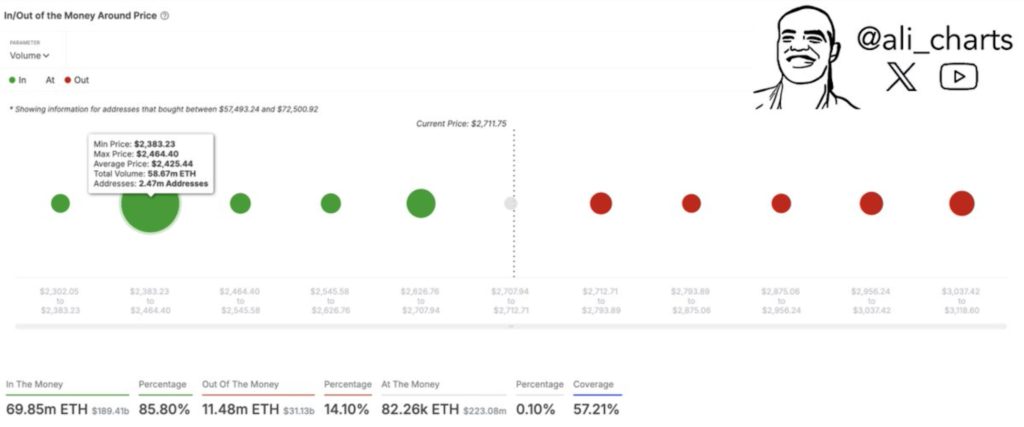
Such a setting increases the probability of price stability or an uptrend persisting on the charts. Given the lack of significant supply barriers, as shown by the scarcity of out-of-the-money positions up to the $3,000 price range, ETH may be primed for a possible upside now.
These levels are essential as ETH closes toward this price target. The strong support base, now firmly below its trading price, fuels optimism.
But what does the momentum indicator say?
What does the momentum indicator read?
A bullish crossover formed on the altcoin’s daily MACD chart, indicating a possible reversal of the downtrend that began in December. This movement coincided with the histogram entering positive territory, further backing the likelihood of an uptrend.
Ethereum displayed signs of stabilization and possible recovery at press time, supported by the recent positive shift in the MACD. If Ethereum preserves this momentum, it could validate the bullish sentiment the MACD indicates. Thus, this might drive the price towards higher resistance levels.
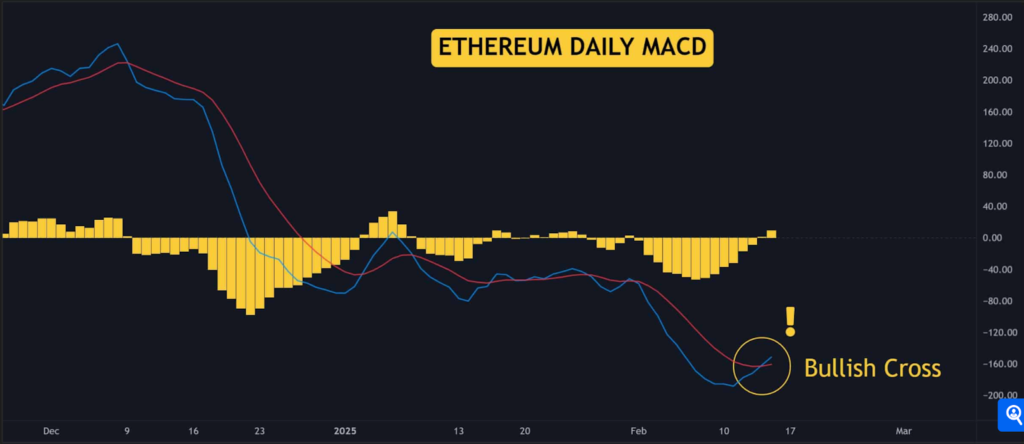
The MACD’s continued divergence from the Signal line could corroborate sustained bullish pressure. A reversal below could imply a false signal, a warning of sustained volatility or a possible retest of lower support levels.
Furthermore, Ethereum’s staking ecosystem has a strong institutional level. Institutional involvement in Ethereum staking could lead to a more significant altcoin rally.
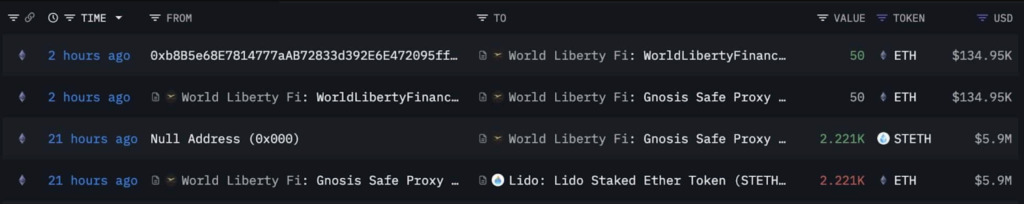
Donald Trump’s World Liberty Financial (WLFI) has staked $5.9 million ETH on Lido Finance. Also, NYSE’s recent filing for Grayscale’s Ethereum ETF to include staking could lead to a notable shift, as analyst James Seyffart remarked on X (formerly called Twitter).
These developments occur after a major market plunge, leading to speculation of an upcoming altseason. This could improve ETH’s liquidity, increase investor confidence, and boost its value while igniting interest in other altcoins.
Institutional investors get active
Market sentiment has gradually evolved from traditional investors holding ETH to selling it. From February 10 to 15, the Ethereum spot ETF turned negative, with approximately 14,000 ETH (estimated at $37.7 million) sold.
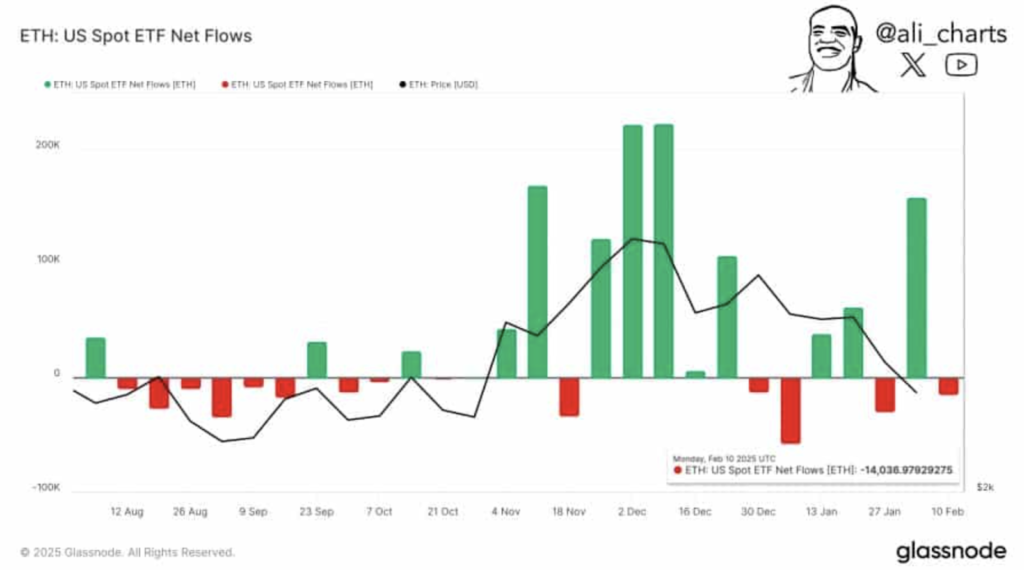
The bullish sentiment has kept increasing as overall selling activity could be linked to profit-taking. If this trend prevails, ETH buying activity among traditional investors could restart with the new weekly open.
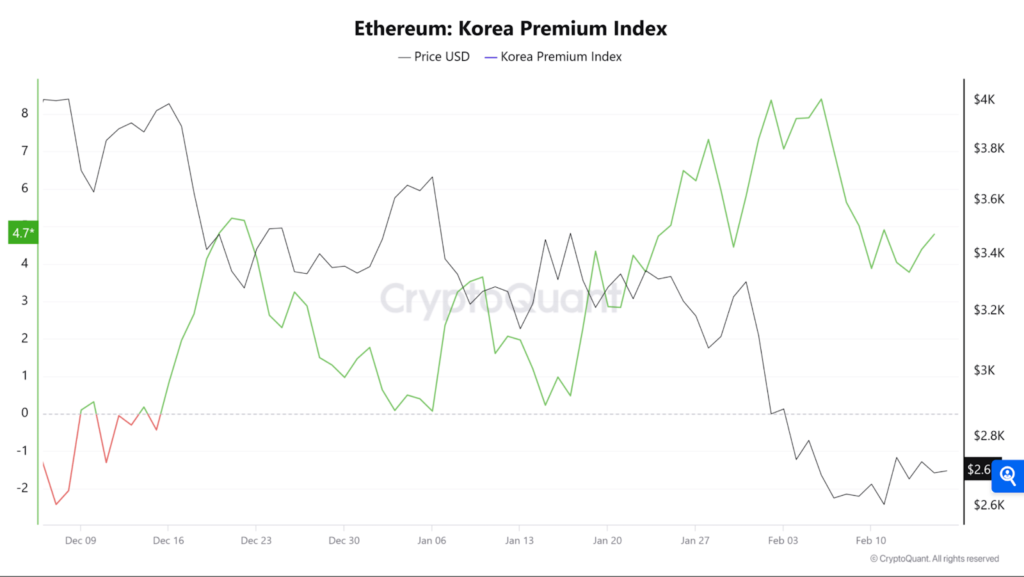
While traditional investors sold ETH last week, retail investors in Korea and the U.S. continued buying, as seen in their respective indexes. Korean retail investors remain bullish on ETH, with the Korea Premium Index staying above zero since December 14. At press time, it read 4.7, a high figure.
The Korea Premium Index measures buying and selling activity on Korean exchanges compared to other exchanges. A metric above zero signals bullish sentiment, while below suggests bearish conditions.
Likewise, U.S. retail investors have persisted with accumulating ETH, although in smaller quantities. This was indicated in the Coinbase Premium Index, which stood at 0.02 at press time. If buying activity among both investor groups remains, it could further contribute to ETH’s bullish sentiment, driving prices higher.
There has been considerable buying activity among derivatives traders. The Taker Buy-Sell Ratio, which compares buy volume to sell volume, read 1.033, indicating more buyers in the market. A ratio above 1 signifies increased buying pressure among derivatives traders.
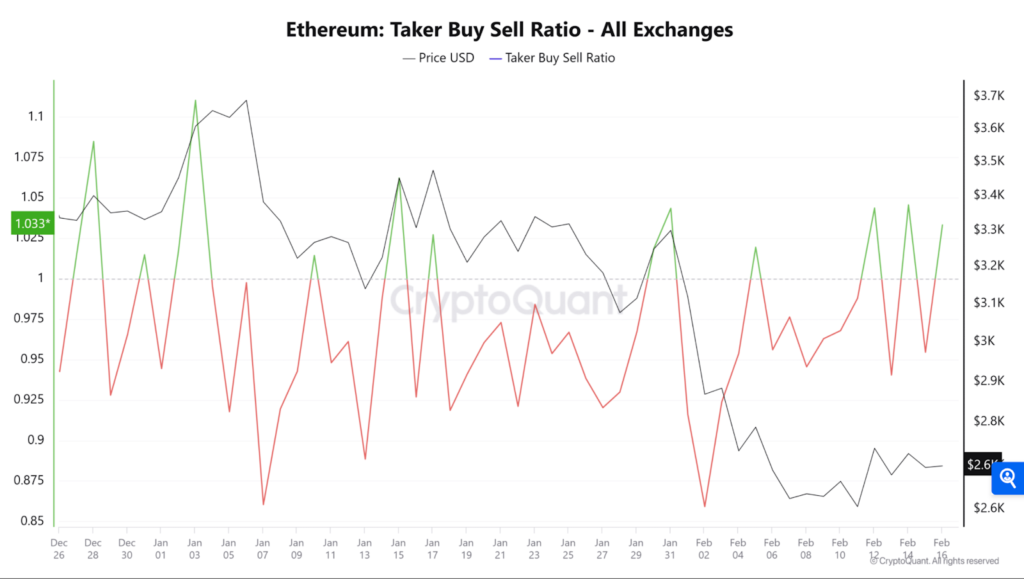
This sentiment aligns with the Funding Rate, which turned positive and settled at 0.0090 at the time of press. A positive Funding Rate indicates that buyers are predominant and willing to pay a premium to maintain market disparity in perpetual and swap exchanges.
How high can ETF approval push SOL to?
The cryptocurrency market watches in anticipation of the recent developments regarding altcoin exchange-traded funds (ETFs) – especially a potential Solana ETF.
The U.S. Securities and Exchange Commission (SEC) has recognized various filings for Solana-based ETFs, indicating a possible change in regulatory approval toward altcoin investment products.
The change in regulatory approach coincides with President Donald Trump’s recent inauguration, whose administration is pro-crypto. Likewise, the appointment of Paul Atkins as the new SEC chair, who seems crypto-friendly, has been a vital factor in this change of stance.
The acknowledgement of Solana ETF filings has led to heightened optimism among investors. This action has led to discussions about SOL’s future price trajectory, with some analysts opining it could reach $550 by the fourth quarter of 2025.
What do analysts think?
In early February 2025, Pantera Capital released a report titled “Headwinds Becoming Tailwinds,” in which general partner Cosmo Jiang and investment analyst Eric Wallach outlined factors signalling a change in market dynamics.
They include political/regulatory inflection, capital increasing, fundamentals improving, rational policy, and macro tailwinds. These changes could lead to SOL ETF approval, as the report suggested,
“We also believe Solana is among the most likely next digital assets to have an ETF. It has strong fundamentals that undergird a positive investment case. It is a widely traded digital asset on large reputable exchanges that can be monitored, and its ownership is widely decentralized – all key considerations.”
Afterwards, the SEC began examining multiple applications for Solana ETFs submitted by prominent asset managers, such as Grayscale, VanEck, Bitwise and 21Shares. This is admirable, given the SEC’s previous fractious relationship with the cryptocurrency ecosystem.
In addition, JPMorgan analysts estimate that Solana ETFs could attract between $3 billion and $6 billion in net assets within the first year.
This influx of institutional investment is expected to significantly impact SOL’s market value. To that end, price prediction models present a range of forecasts for its value by the end of 2025.

What does the market say?
DigitalCoinPrice estimates that SOL could reach a high of $531.91, with an average price of around $479.88. Conversely, LongForecast provides a more bullish outlook, predicting that SOL could exceed the $550 mark as soon as August 2025, with possible highs reaching $858 by December 2025.
The possible approval of Solana ETFs is a significant milestone for Solana and the broader cryptocurrency market. Projections of SOL reaching $550 by Q4 2025 are encouraging but depend on favorable regulatory developments, successful launches, and sustained growth within the Solana ecosystem.
Still, investors should closely monitor essential technical levels and market sentiment to navigate the forthcoming months.
BNB’s TVL surges by $665M
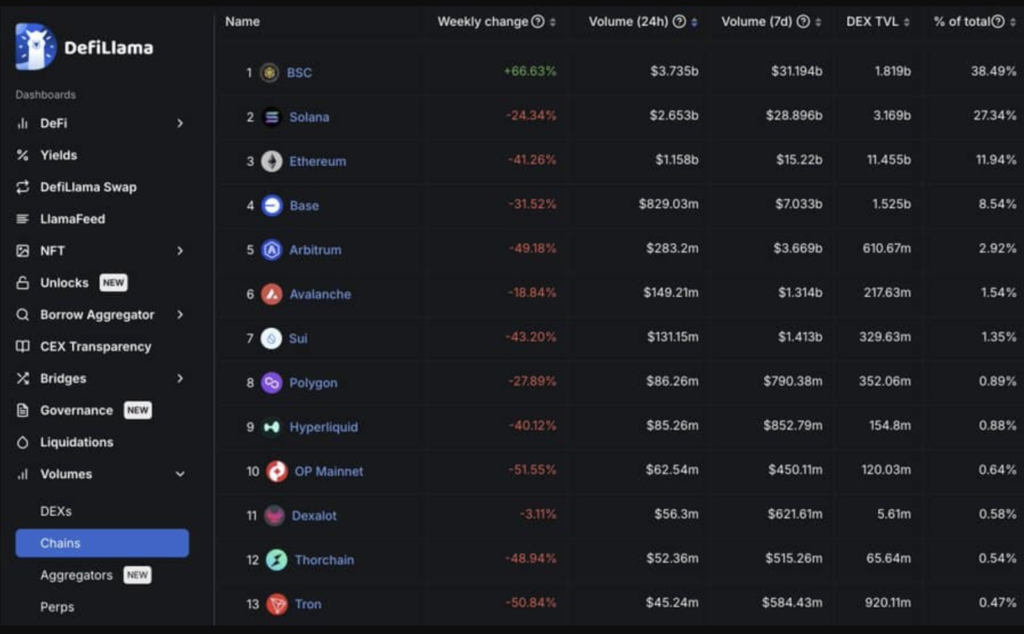
BNB Smart Chain (BSC) has recorded the highest volume across all other chains in the past month, increasing its TVL. It remains the only chain to register positive volume growth recently, while others like Solana, Ethereum and Base have dropped.
During analysis, DeFiLlama indicated that BSC’s weekly volume growth reached 66.63%, reaching 31.194 billion, and in the past 24 hours, it has risen to $3.735 billion. Also, the Total Value Locked (TVL) has risen from $4.895 billion to $5.56 billion – a $665 million increase.
What led to this?
There has been an increase in BNB buying volume across top crypto exchanges such as Binance and OKX. This was affirmed by the Taker Buy Sell Ratio increasing above 1 on both exchanges, with readings of 1.727 and 2.33, respectively.
When the Taker Buy Sell Ratio is above 1, it suggests more buying volume among these perpetual traders in the market than selling volume. Typically, the further away from 1 it is, the more buying volume there is compared to selling volume.
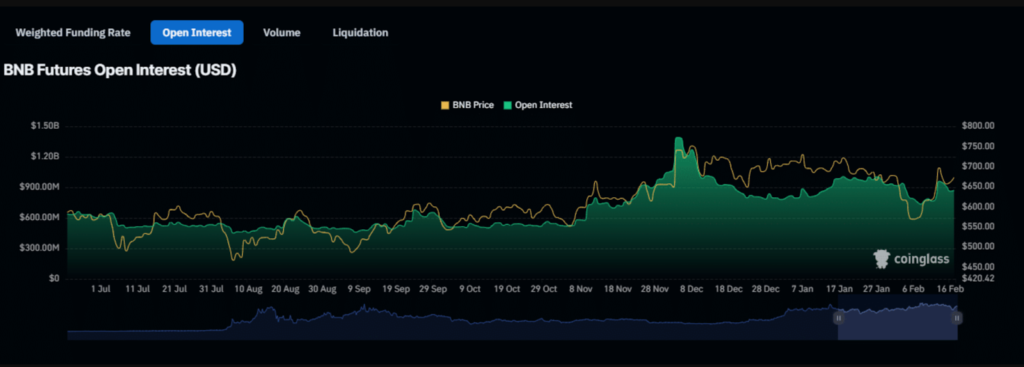
The Open Interest, which records the amount of unsettled derivative contracts in the market, has also witnessed an incremental rise. Its growth of 1.78% brought the total value of these contracts to $866.70 million.
Likewise, between February 10-16, a notable surge in exchange netflow was recorded. It had a reading of approximately $142 million in netflow – the highest since May 2021.
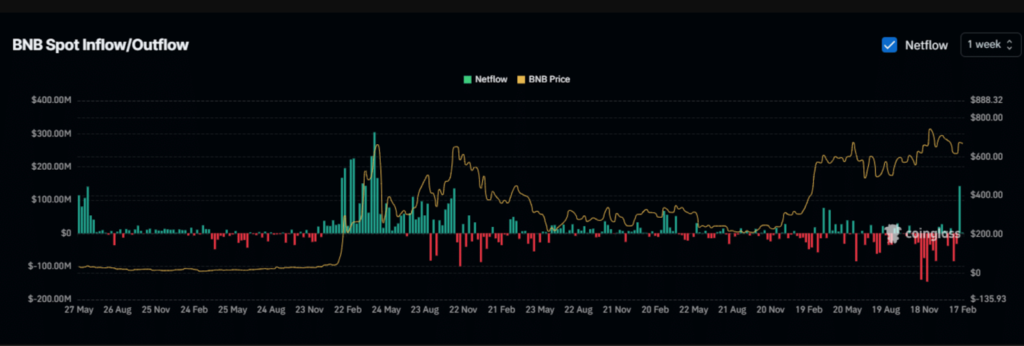
A surge such as this indicates that sellers are moving their assets into exchanges with the plan to sell. Yet, despite this large sell volume on the spot market, BNB rose by 10%, signalling the presence of demand to acquire the sold assets.
The surge in BSC’s TVL suggests growing confidence and renewed interest in its network. Over time, if the demand keeps rising, this could lead to a price rally for BNB.
Closing Remark
Although Bitcoin continues to trade sideways, the consensus is that it remains a long-term investment as the supply of LTHs continues to rise. Institutional interest in Ethereum continues to grow, and if the altcoin can preserve this momentum, it could validate the bullish sentiment the MACD indicates.
Now that the SEC seems more open-minded about crypto, acknowledging Solana ETF filings has increased investors’ optimism about SOL. Finally, with BNB Smart Chain’s TVL increase, it is a chain to look out for.
Zypto Launches Native Pi Network dApp!
Zypto has officially launched its native Pi Network dApp, bringing real-world utility to Pi holders! Now accessible via the Pi Browser App at pi.zypto.com, the dApp enables Pioneers to test Zypto’s Pi Payment Gateway and explore new ways to use Pi Coin for crypto cards, bill payments, gift cards and more. Stay tuned for upcoming features and expanded integrations!
Find out more here.
There goes your weekly crypto update, folks. If you have any thoughts, arguments, or suggestions, please share them in the comment section.

FAQs
What impact can an ETF have on Solana?
SEC’s acknowledgement of Solana ETF filings has led to heightened optimism among investors and upbeat predictions by analysts.
What did the Ethereum MACD indicator read?
The Ethereum daily MACD chart indicated the formation of a bullish crossover.
What impact does institutional interest have on Ethereum’s value?
Institutional involvement in Ethereum staking could lead to a more significant altcoin rally.
Why are BTC LTHs supply rising?
This means long-term holders (LTHs) are not selling their BTC, which implies strong market confidence.
What led to BNB’s TVL surging by $665M?
BNB’s TVL rose due to increased BNB buying volume across top crypto exchanges such as Binance and OKX.


0 Comments