This week saw surges in the total value locked (TVL) of multiple DeFi platforms and increases in the volume and prices of different tokens. Lastly, Bitcoin long-term holders (LTHs) profited from BTC’s rally by cashing out their investments.
Join me as we dive deeper into these updates.
Bitcoin LTHs cash out at 326% profit
With Bitcoin (BTC) continuing its outstanding rally, long-term holders (LTHs) are taking the initiative to cash out. This has provided them with gains of approximately 326% on their investments, with an average entry price of $23.4K.
Consequently, this surge in profit-taking has increased selling pressure in the market. This aligns with previous historical patterns where substantial price increases trigger profit-taking. Yet, the selling wave is more strategic than reactive.
With BTC trading above the LTH cost basis, many traders choose to de-risk amid macroeconomic uncertainties. These include possible interest rate shifts and market liquidity concerns. The nature of Bitcoin’s halving events may also play a role in this, with some LTHs predicting a temporary decline.
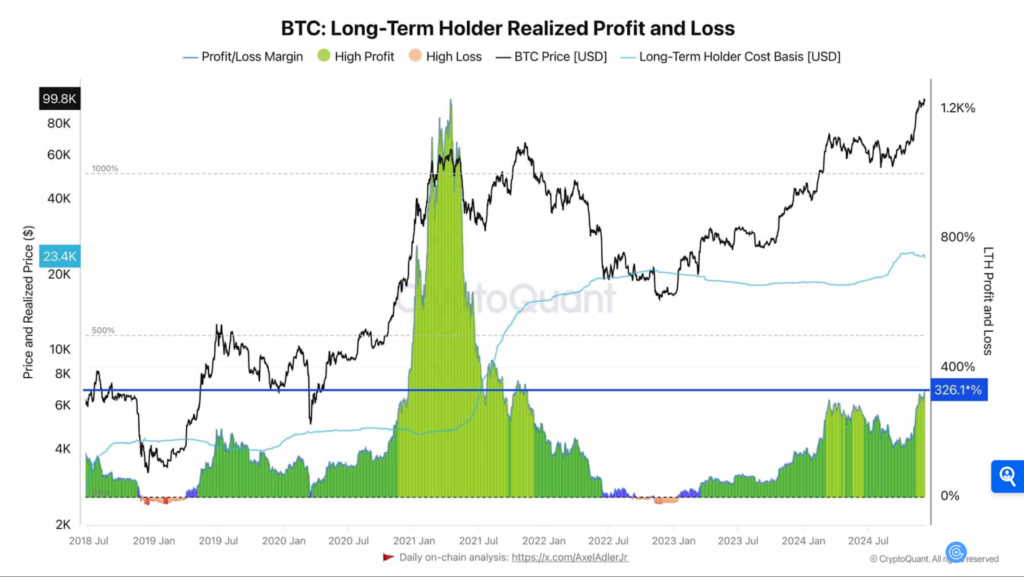
Despite immense pressure, BTC has shown resilience by redistributing rather than abruptly selling off. This difference in market dynamics could control the narrative regarding BTC’s near-term trajectory.
How?
New investors are absorbing the BTC supply
Typically, the recent surge in BTC’s price shows a shift in which demand, rather than supply, drives its growth. Thus, new investors, mainly those leveraging financial assets like Bitcoin ETFs, have played an essential role in absorbing the available supply.
An example is the iShares Bitcoin Trust by BlackRock, which accrued $10 billion in assets under management (AUM) within seven weeks, more than 40% of spot ETF volumes. This rapid adoption has led to projections that Bitcoin ETFs might soon surpass gold ETFs in total assets.
Their influence could soar further as Bitcoin ETFs funnel 75% of new BTC investments. Thus, the anticipation of reduced supply, alongside increasing demand, places new investors as vital drivers of Bitcoin’s price momentum.
So, what’s next for BTC?
With BTC navigating increased selling pressure from long-term holders, the road ahead seems influenced by critical updates.
First, the halving event tightened the BTC supply, increasing scarcity. Then, institutional interest, primarily through spot Bitcoin ETFs, could stabilize demand and foster more adoption. Nonetheless, regulatory clarity remains vital for BTC’s mainstream recognition.
By being linked to macroeconomic trends and traditional assets, Bitcoin is positioned as speculative and maturing. Its ability to maintain growth or navigate volatility depends on balancing innovation, adoption, and the divide between scarcity and liquidity.
Bitcoin targets $103K next
After last week’s U.S. inflation and labour data, the crypto market was pricing a 96% chance of another 25bps interest cut during the next Fed rate ruling on December 18.
Lately, Bitcoin (BTC) has been higher than $100K, but the Fed rate could determine its subsequent decision to cut direction. One such was a likely liquidity hunt at $103K/$104K, according to BTC trader Cryp Nuevo.
He analyzed on X (formerly called Twitter);
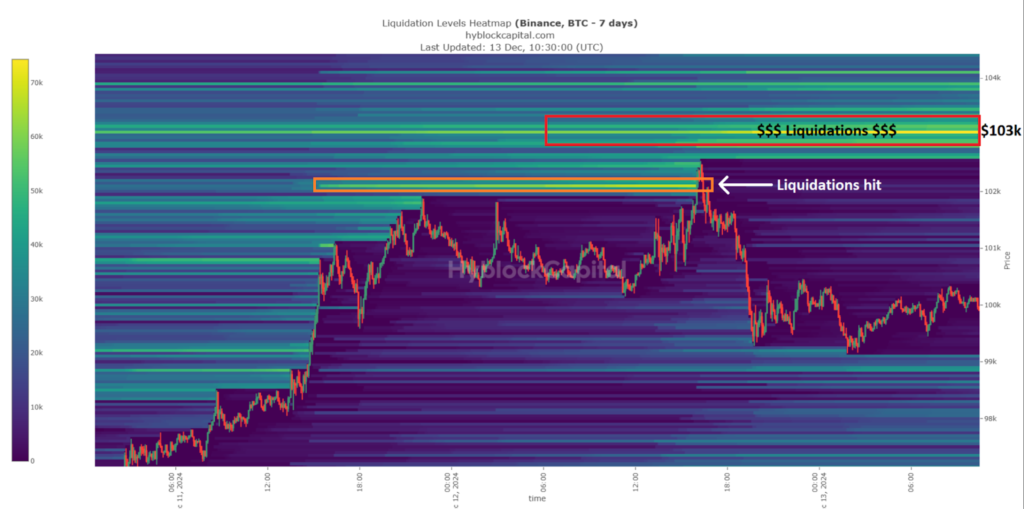
At press time, substantial leveraged short positions at $103K-$104K still existed, which buttressed the analyst’s prediction. On the 12-hour chart, BTC has been consolidating around its ascending channel’s mid-range. The $103K/$104K target was about 2% from the mid-range.
The upper channel target of $107K was 5% from the mid-range level, but it had less liquidity and might not attract price action at the $103K level. If that happens, BTC could hit the $103K/$104K targets, pushed by a liquidity sweep, and then retreat less.
Its range-low has stopped earlier retracements, and the possible pullback could ease at $97K. Thereafter, BTC could continue its range-bound movement. The retreating global longs indicator supported the possible slip to range-low after reaching $103K.
The oscillator always increases when BTC falls and drops when BTC pumps. At press time, the indicator approached its bottom and could reverse, marking a possible BTC retracement and bull trap.
Bitcoin Rainbow Chart hints at $500K peak this cycle
Bitcoin’s (BTC) rainbow chart has renewed hopes of a $500K price peak in this cycle. Favorable recent macro trends and network growth indicated a longer trajectory than previous cycles.
Unlike the last cycle, which was delayed before the ‘extreme phase,’ current developments exhibited more potent momentum. Since last month, essential indicators and evolving market dynamics have strengthened the case for Bitcoin to get to new highs and probably hit $500K.
How can BTC get to its next all-time high?
First, since November, Bitcoin’s developments outlined its increasing legitimacy as a financial asset. They include:
- Sovereign wealth and pension funds have increased their exposure.
- BlackRock’s iShares IBIT Bitcoin ETF attracted over $17 billion in inflows, showing surging institutional demand.
- Spot BTC ETFs globally have also propelled liquidity, enabling accessibility and bridging traditional finance with crypto.
- The lightning network provides fast and low-cost transactions for practical use cases.
- Inflation concerns and a weak U.S. dollar have strengthened BTC’s role as a decentralized store of value.
With regulatory clarity, favorable macro trends, and further development aligning, BTC can keep growing. Thus, these factors support speculation about a $500K supercycle target.
Furthermore, BTC’s past cycles indicate obvious patterns of parabolic rallies breaching the red ‘Maximum Bubble Territory,’ as seen in 2013 and 2017. Yet, the 2021 cycle diverged, stalling in the ‘FOMO intensifies’ phase thanks to macroeconomic headwinds and lesser speculative frenzy.
This deviation outlined BTC’s evolving market dynamics, where institutional participation and regulatory scrutiny reduced extreme volatility.
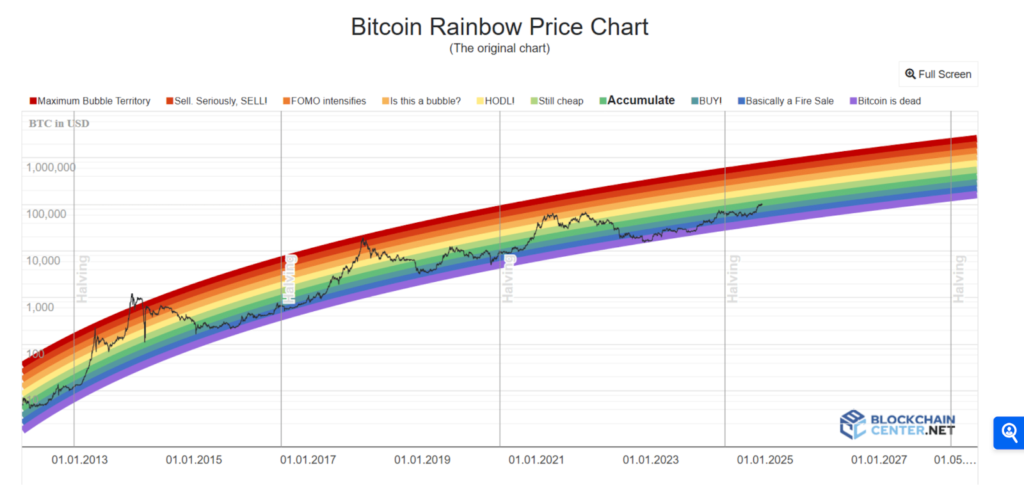
In this cycle, increasing institutional inflows – led by spot BTC ETFs and sovereign wealth interest – could push BTC into the ‘extreme phase’ more sustainably. If BTC revisits the rainbow’s red zone, it could indicate a more stable climb, aligning with a supercycle thesis instead of a speculative blow-off top.
Unlike previous runs fueled by retail euphoria, this cycle’s measured momentum shows deeper liquidity and better market infrastructure. With BTC adoption accelerating through innovative technologies, the rally may exhibit fewer abrupt peaks and corrections.
Finally, with BTC’s optimistic trajectory, some essential challenges persist: regulatory uncertainty, governmental policies, macroeconomic shocks, on-chain metrics, and competition from emerging blockchain technologies.
Blur NFT market trading volume surges 5X
The daily trading volume on the Blur (BLUR) NFT marketplace surged by more than 5X last month in November. This was the most significant increase in volume, surpassing $35 million.
The volume spikes occurred in sharp and random bursts, indicating reactive trading behavior. This surge coincided with increased activity, indicating a growing interest in NFT platforms, which may have influenced the price of the BLUR token.
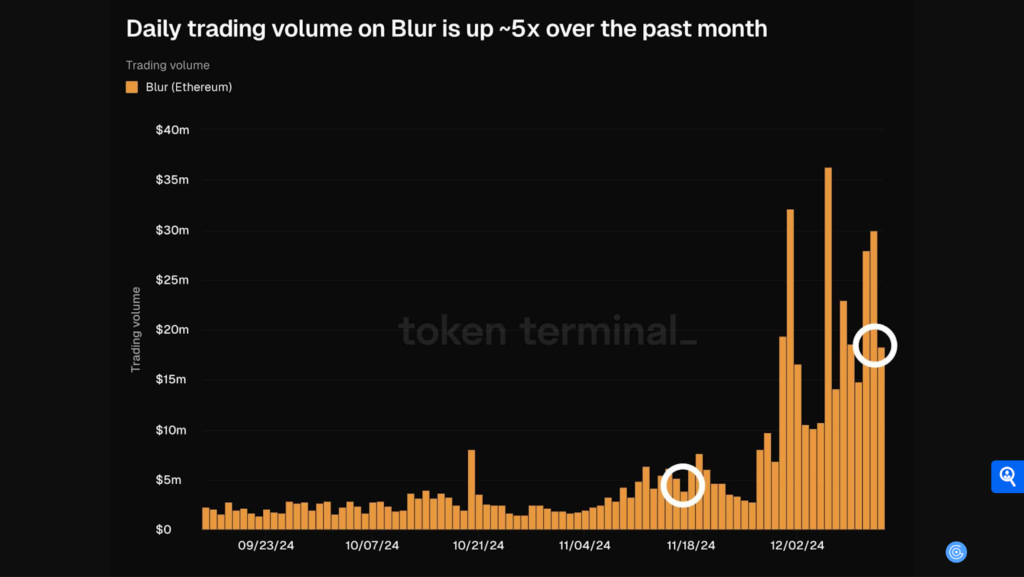
If increased NFT activity persists, the price of BLUR could respond positively, similar to the peaks in volume. Conversely, this could depend on the other conditions and the sustained interest in trading on the Blur platform.
This implies that BLUR was becoming an essential player in the NFT space.
Furthermore, BLUR’s short-selling activity over the past week led to a quick spike in price, trapping shorts due to the quick rebound. This outlined the concentration of orders, signalling crowded short trades.
Thereafter, new shorts entered the market, only to be trapped as the price increased quickly, reaching a peak of around $0.44. The trapped shorts indicated volatility and the risk of betting against a strong BLUR uptrend.
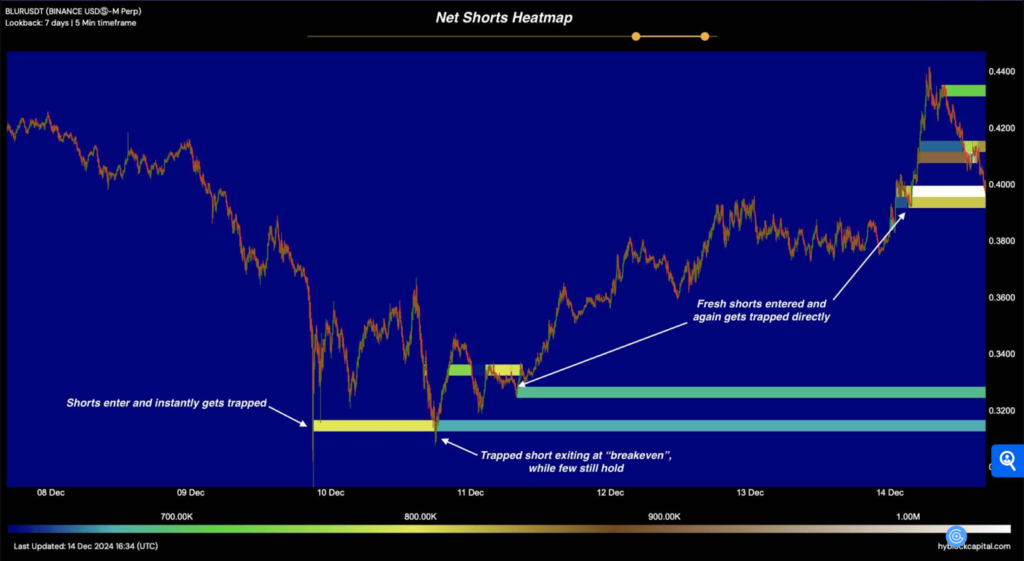
This activity indicated where shorts entered and the exit points, inferring potential continuation if the trend of trapping shorts persists, leading to possible short squeezes that could further drive up prices.
Prediction for BLUR
By mid-December, BLUR started the month at $0.25 and quickly climbed to nearly $0.45. This strong response to the resurgence in the NFT market likely attracted more traders.
It showed a bullish trend, consistently staying above both the 50-day and 200-day SMAs, indicating strong upward momentum. The MACD’s being below the price confirmed bullish sentiment, as it remained positive throughput.
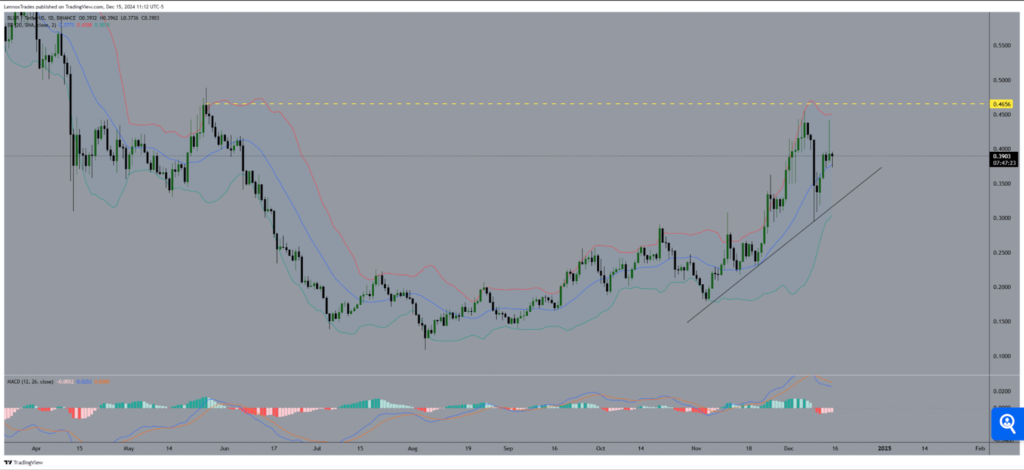
An outflow of funds surpassing $6 million overlapped with a spike in BLUR’s value, suggesting strong buying interest or withdrawal from exchanges.

Netflows remained relatively stable, followed by a rapid outflow, indicating high volatility yearly. The patterns implied that the inflows and outflows were crucial. If the trend persists, BLUR could experience additional price volatility due to large transfers in and out of exchanges.
SUI TVL surpasses $1.7B
Sui Network’s (SUI) DeFi ecosystem recently hit a milestone in total value locked (TVL). The surge in TVL outlined the increasing adoption and investment in SUI’s landscape.
According to DefiLlama’s chart, an analysis of the TVL showed it was $1.79 billion at press time. Then, on December 12, it reached its all-time high of $1.8 billion.
The TVL chart highlighted SUI’s massive growth over the past year. From humble beginnings, SUI has consistently climbed, showing elevated activity.
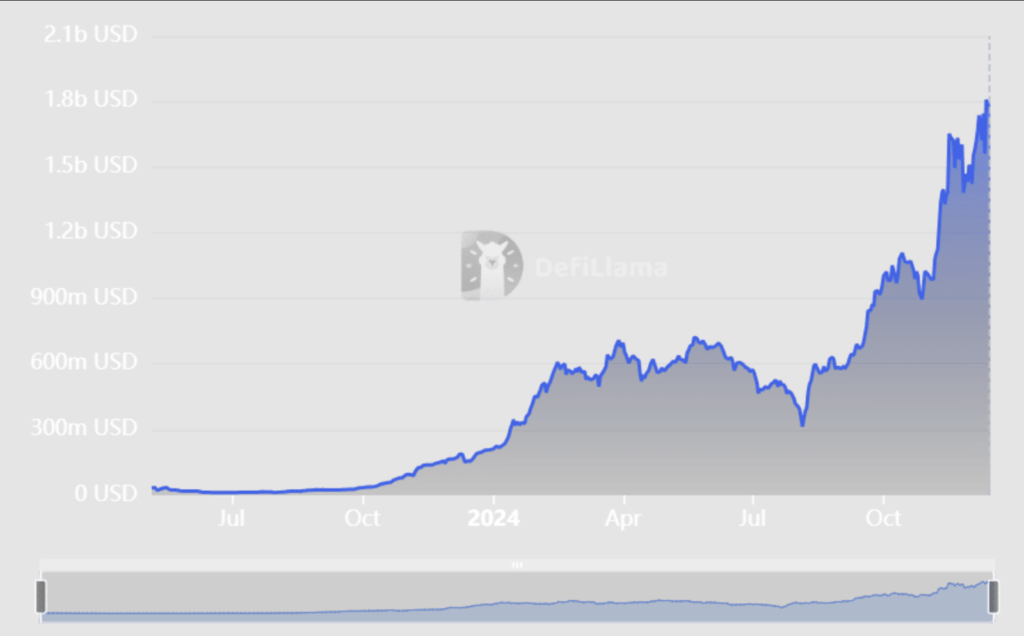
What is behind SUI’s growth?
SUI’s growth has been fueled mainly by lending platforms like Suilend and NAVI Lending. Together, they account for about 58% of the network’s locked assets, with Suilend’s TVL at $552.5 million and NAVI’s at $491.23 million.
Furthermore, SUI’s volume has intersected with TVL. At the time of this writing, its volume was typically about $168 million. However, on December 12, the network’s volume spiked to its highest level, at over $551 million.
This coincided with when the TVL also hit its ATH on December 12. Similarly, the price hit its ATH on December 13, when it rose to $4.76 – a day after the network’s volume and TVL hit their milestones.
SUI’s price has imitated its DeFi landscape’s growth, rallying massively over the past months. The $1.7 billion TVL milestone, fueled by SuiLend and NAVI Lending, showed the network’s capability. That said, SUI looks well-positioned for additional growth.
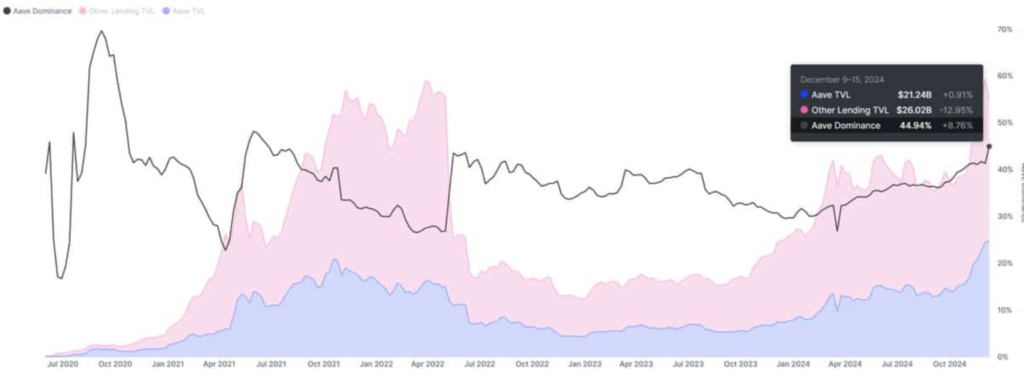
Aave’s TVL increases to $21 billion
Aave (AAVE) continues to dominate the DeFi lending sector, leading with a 45% market share. This undisputed position mirrors increasing enthusiasm in Aave’s platform as its TVL and token price show a strong uptrend.
A DeFiLlama chart underscored a notable surge in Aave’s TVL, which stood at over $21 billion. This depicted a significant portion of the total lending market value, further reinforcing Aave’s position as a leading voice in the DeFi space.
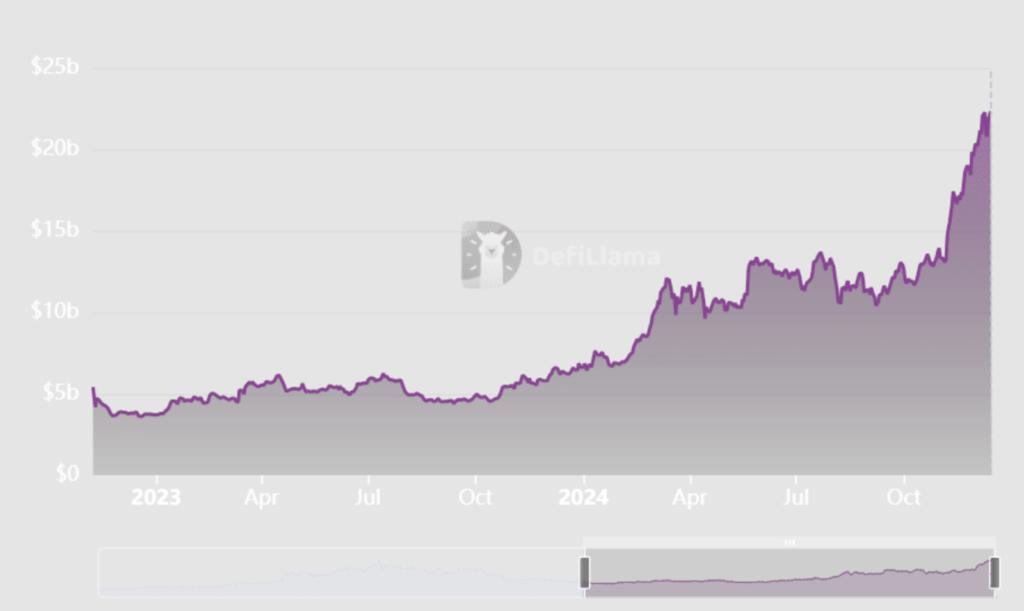
Further analysis of Aave’s TVL trend over the past year revealed constant upward growth, mainly since the beginning of 2024. This shows that the current TVL is the highest in history.
The recent surge overlaps with heightened liquidity inflows led by institutional and retail interest in decentralized lending protocols. The dominance chart from IntoTheBlock depicts Aave’s stability and resilience in maintaining its leading position.
While other lending platforms have been slightly unstable, Aave has shown consistent growth, recently recording a prominent increase in dominance over the past growth. These developments show Aave is the preferred choice for decentralized borrowing and lending.
What is the AAVE price saying?
AAVE’s price has reflected the surge in TVL. Current data shows that token trading is at $373.77. This marks a substantial upward trend in the last few days, as further analysis revealed a 21.20% spike on December 12.
This bullish momentum has pushed AAVE to rally sharply since November, breaking key resistance levels. The increase in trading volumes also validates AAVE’s price breakout, inferring buying activity. So, if the momentum persists, AAVE may reach higher levels.
AAVE’s dominance in the decentralized lending sector puts it in a strong position to capitalize on the growing momentum within the DeFi space. Thus, the rising TVL and token price performance show a favorable trajectory that could soon lead to more records.
Although AAVE’s price is overbought, suggesting possible short-term corrections, sustained liquidity inflows and market sentiment could support its growth.
Closing Remark
The trading volume surge for Blur coincided with increased activity and indicates a growing interest in NFT platforms. Then, the spikes in SUI’s and Aave’s TVL outlined their increasing adoption and investment in the DeFi landscape.
Lastly, as BTC navigates increased selling pressure from long-term holders—via investors—critical updates seem to influence the road ahead. Time will tell how that might play out.
Zypto is committed to offering you the best and most secure crypto services. Our services are tailored to your needs, and we provide a smooth and fast onboarding process to get you started in the crypto space.
Zypto has just launched the global USDC-to-Cash & Cash-to-USDC service with Stellar and Moneygram. Learn about the revolutionary global on and off-ramp service here.
Zypto has also extended its ‘Pay Bills With Crypto’ service, launching support for in India, Egypt, Malaysia, Pakistan, Costa Rica, Honduras and Guatemala. This makes it possible for users to pay a wide range of companies and utilities directly from their DeFi wallet with different cryptocurrencies like Bitcoin (BTC), Ether (ETH), Solana (SOL), Stellar Lumens (XLM) and hundreds more.
Find out more here.
What are your thoughts on this week’s crypto news? Did any particular development stand out for you? Leave a comment below and let us know your perspective.

FAQs
What effect did the LTHs cash out have on BTC?
The surge in profit-taking from the LTHs has increased selling pressure in the market.
How are investors absorbing the BTC supply?
Since demand drives BTC’s growth, new investors (Bitcoin ETFs) like the iShares Bitcoin Trust by BlackRock have accrued $10 billion in assets under management (AUM) within seven weeks.
What led to BLUR’s NFT trading volume surge?
This 5X surge coincided with increased activity, indicating a growing interest in BLUR’s NFT platform.
How did SUI TVL surpass $1.7B?
SUI’s growth has been fueled mainly by lending platforms like Suilend and NAVI Lending, which account for about 58% of the network’s locked assets.
What led to Aave’s TVL increase?
Aave’s 45% market share domination of the DeFi lending sector is behind its TVL and token price uptrend.











0 Comments