This week marked many milestones as the crypto market still buzzes about Bitcoin’s monumental feat of reaching $100K. The global crypto ecosystem has been on a general uptrend, positively affecting various assets.
Join us as we discuss the latest happenings in the crypto ecosystem.
Crypto investment inflows hit $41B YTD
Crypto investment products have reached unprecedented heights by recording weekly inflows of $3.85 billion.
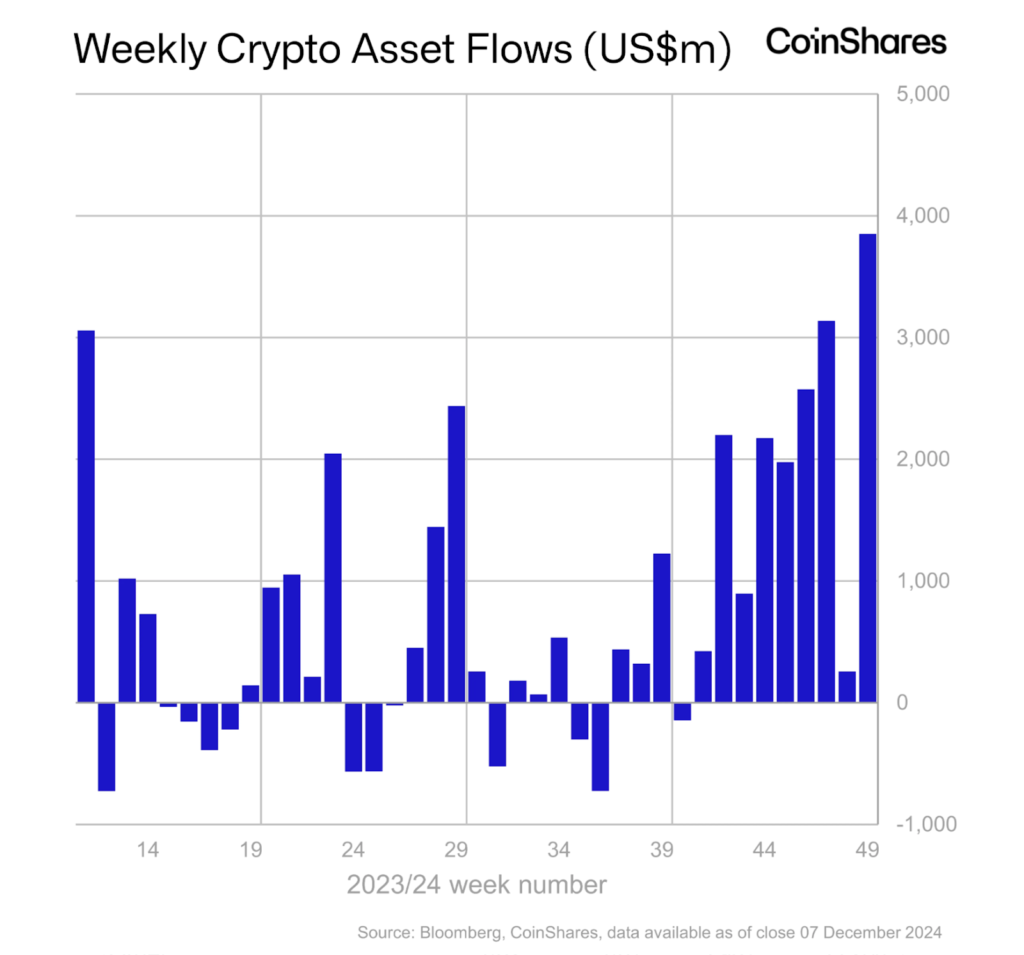
According to CoinShares’ latest report, this surge has pushed the year-to-date inflows to $41 billion and the assets under management (AuM) to $165 billion.
This means that the inflows have exceeded the previous benchmarks set in 2021, wherein there were $10.6 billion in total inflows and $83 billion in AuM.
How did the cryptos fare?
Bitcoin (BTC)-focused assets recorded $2.56 billion, while Ethereum (ETH)-focused products attracted a $1.15 billion inflow. Unsurprisingly, these two were the leading coins.
The report stated,
“Bitcoin saw inflows of $2.5 billion, bringing YTD inflows to $36.5 billion. Short Bitcoin has seen tepid inflows of $6.2m, and historically, we have seen much higher inflows after sharp price rises, suggesting investors remain cautious about betting against the recent strong price momentum.”
In addition, Ripple (XRP) investment products recorded outstanding inflows of $134.4 million last week, almost half the $275 million year-to-date total.
Then, Cardano’s ADA investment products attracted major attention. They secured $5.2 million in inflows and contributed to a quarter of the year’s total inflows for these assets.
Altcoins like Binance (BNB), Litecoin (LTC), and Chainlink (LINK) also got investments, with inflows ranging from $0.7 million to $2.2 million. Finally, short Bitcoin products saw inflows of $6.2 million, reflecting varied market sentiment.
Ethereum whale transactions increase by 300%
Ethereum recorded notable growth in large transactions. On December 6, its weekly volumes increased by more than 300% to $17.15 billion before declining to $7 billion.
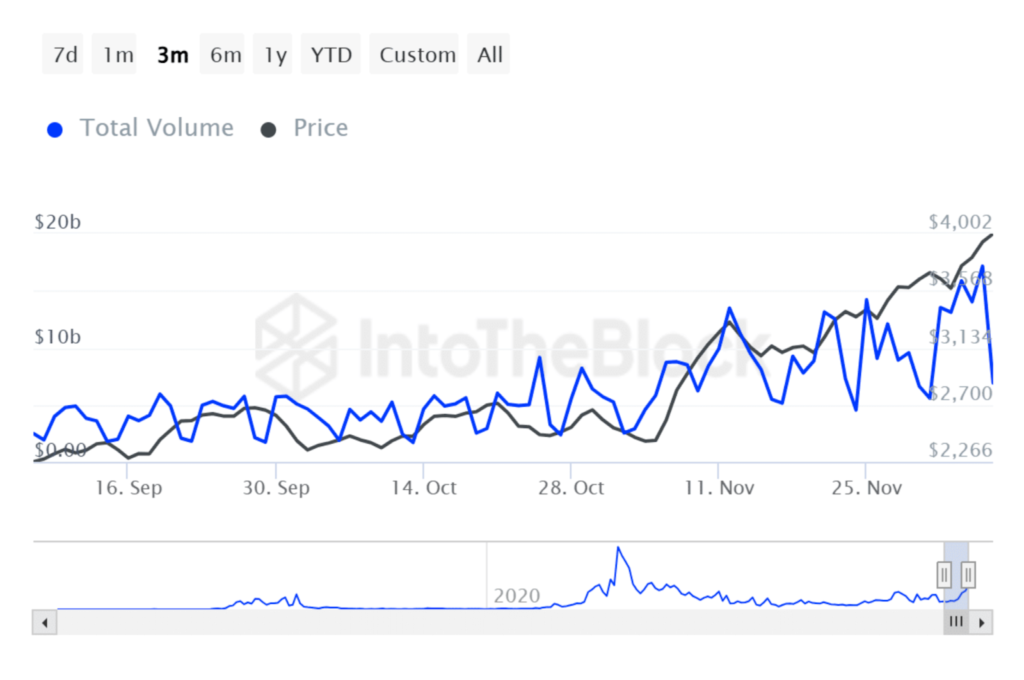
This uptick has led to curiosity about the implications of these large transactions, primarily because Ether’s (ETH) price is approaching vital psychological levels.
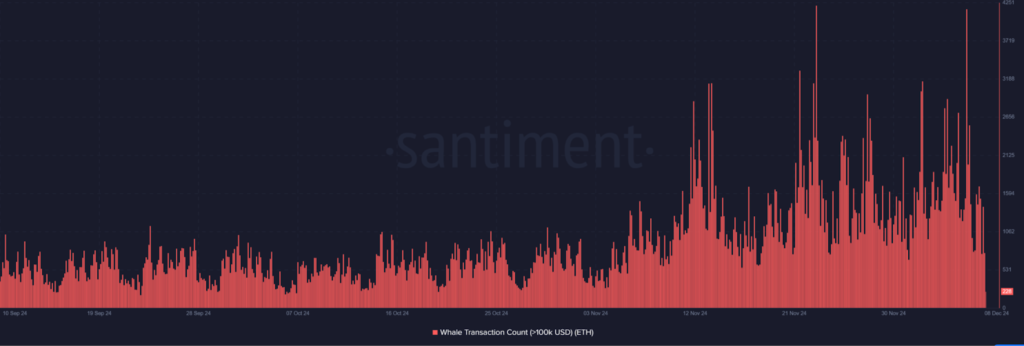
Furthermore, the large transaction chart on Santiment shows a spike in the number of transactions surpassing $100,000 in value, implying whale activity.
This institutional activity coincides with Ether’s (ETH) rally to $4,000, suggesting that some whales may be taking profits or redistributing holdings. It also shows how the whale transaction chart highlights periodic peaks, emphasizing strategic moves during volatile price phases.
As exchange netflows indicate reduced selling pressure, the market targets key psychological resistance, with bullish momentum and firm support levels shaping the outlook.
The exchange netflow chart depicts alternating inflows and outflows, with massive outflows indicating reduced selling pressure. The analysis of the chart showed a negative netflow of over 17,000.
This behavior naturally signals a bullish sentiment as traders move assets into storage. Nonetheless, the price has faced resistance of nearly $4,000, which coincides with the psychological barrier and profit-taking activity.
How is the ETH price performing?
Ether’s (ETH) price chart reflects a continuous uptrend since the beginning of November, with the 50-day moving average offering solid support. The recent rally to $4,000 was accompanied by increased volume, which indicates strong market participation.
Yet, key support levels lie at $3,800 and $3,500, which align with the 50-day moving average. Prior resistance levels have now become support. This surge in large transactions outlines growing interest and activity among whales, most likely led by Ethereum’s bullish sentiment.
Overall, the price action indicates that Ethereum is in a healthy uptrend. Key support levels are holding firm, and momentum indicators support further upside. Nonetheless, resistance at $4,000 must be closely watched, as the market could temporarily cool off before striving for higher levels.
Algorand TVL spikes by over 300% in a month
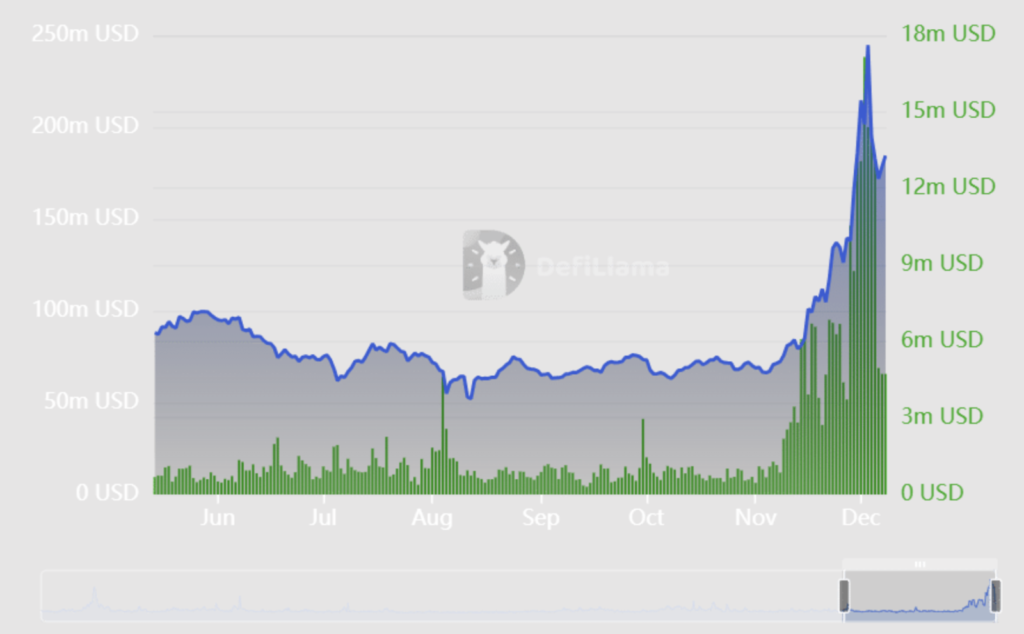
Algorand has enjoyed a remarkable increase in Total Value Locked (TVL), recording over 300% growth within the past month. Per data from DeFiLlama, Algorand’s TVL surged to $244.74 million – its second-highest level in history.
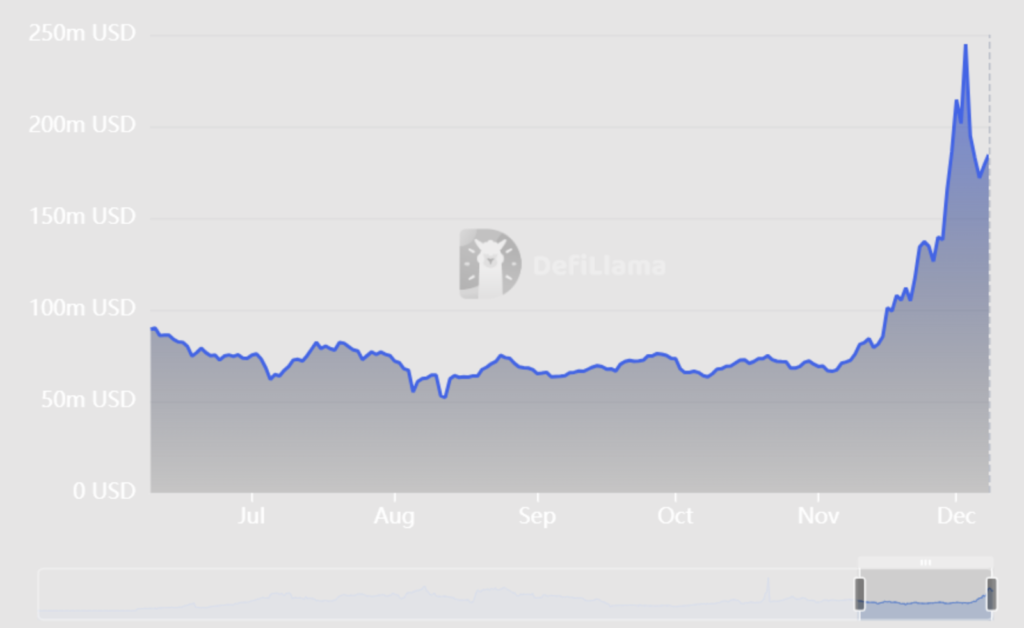
The DeFi protocol Folks Finance spearheaded its growth, which increased by 289% over the past month and locked over $284 million in assets. Other DeFi protocols on Algorand were also behind its development, which indicates heightened interest in Algorand’s ecosystem.
Although Algorand’s (ALGO) TVL slightly retraced to around $184.5 million, its overall growth suggests bullish momentum, an upward trajectory, and increased network activity.
What impact has this had on ALGO’s price?
ALGO, Algorand’s native token, has exhibited positive on-chain metrics and considerable price gains. It was trading at $0.4966, dipping slightly from its recent highs but retaining a strong uptrend.
Moreover, Algorand’s recent performance in Total Value Locked (TVL) is supported by its substantial trading volume, which surged to $27.36 million on December 8.
DefiLlama said Algorand’s network volume surged considerably, peaking at 2.33 billion ALGO in late November. This is synonymous with the TVL growth recorded on Folks Finance, which signifies increased activity on the Algorand blockchain.
While it has since retraced to approximately $788.44 million, the elevated levels still indicate increased network activity.
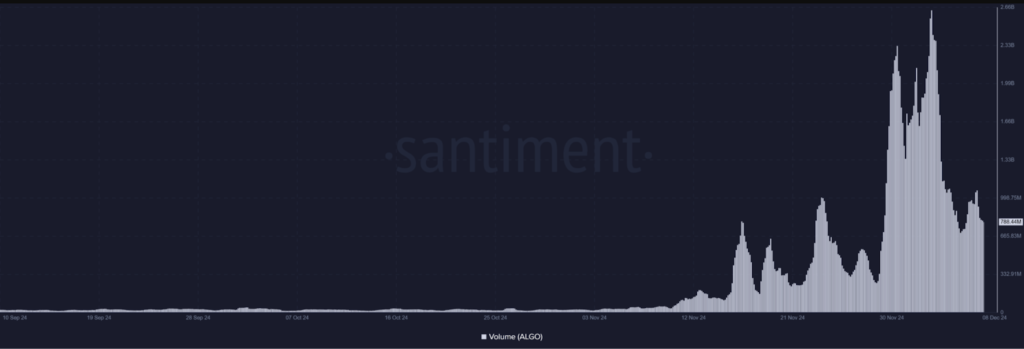
Still, with both metrics reducing from their recent highs, the network can maintain its recent momentum or if a correction is on the horizon.
Ethereum Funding Rates shows bullish sentiment
Ethereum’s Funding Rates have recorded an essential moment in market dynamics. According to a CryptoQuant chart, they hit 0.03%, indicating bullish sentiment and rising market interest.
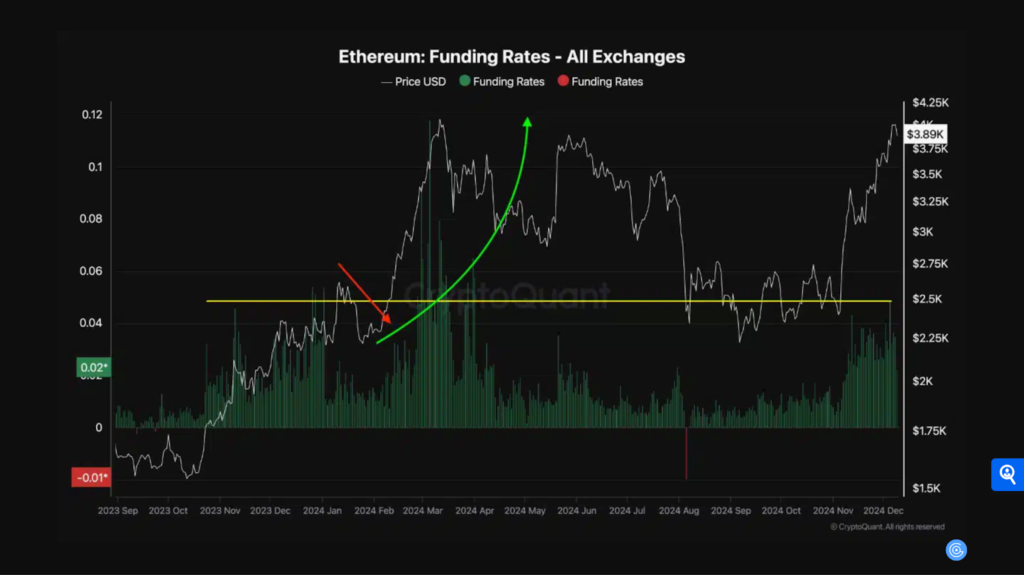
The Funding Rates increased to multi-month highs, with levels last observed in January 2024, when Ether (ETH) experienced an upward rally of 88%. These key levels include $3,800 resistance and $3,700 support as momentum builds.
This surge shows rising bullish sentiment in the derivatives market, led by increased open interest and shifts in trader positions. The metrics infer possible upside momentum for Ethereum as the market monitors critical price levels.
Typically, elevated funding rates indicate traders’ preference for long positions, reflecting expectations of additional price growth. If historical patterns hold, the Funding Rate milestone may signify future things.
How bullish is the sentiment?
According to Coinglass, the long/short ratio was 0.9301% at press time, with long positions accounting for 48.18% and short positions accounting for 51.81%, respectively. Yet, analyzing the number of trader accounts indicated a significant difference.
The 81.47% long accounts and 18.53% short accounts lead to a long-to-short ratio 4.40. This discrepancy outlines a market where fewer traders hold large short positions while a considerable majority are confident of Ethereum’s long-term price growth.
Such inequality could increase volatility, as any notable liquidation could trigger sharp price movements.

In addition, Ethereum’s open interest rose to over $19.5 billion, mirroring heightened trading activity and expanding investor interest in ETH derivatives. This consistent rise in open interest and higher Ethereum Funding Rates indicate a strong capital inflow into the market.
Typically, such conditions have preceded significant price movements, and the current trend suggests that Ethereum may be preparing for another massive rally.
Yet, open interest has drastically decreased. The analysis revealed a decline of about $17.5 billion. Even with the drop, the bullish sentiment remains high.
What does this mean for Ethereum’s value?
Ether (ETH) is trading at $3,722.55 at this writing, exhibiting positive momentum. The daily chart reflects a bullish structure, with essential technical indicators aligning to support additional growth.
Its trading volume has also increased alongside open interest, a long/short ratio, and the Ethereum Funding Rates, showing strong market participation and lowering the possibility of false breakouts. This supports the bullish case for Ethereum’s price movement.
Although historical trends imply a possible rally, traders should be wary of volatility induced by over-leveraged positions. Ethereum’s ability to break above key resistance levels will decide whether this bullish momentum can be sustained soon.
DeFi TVL surges to $133 billion
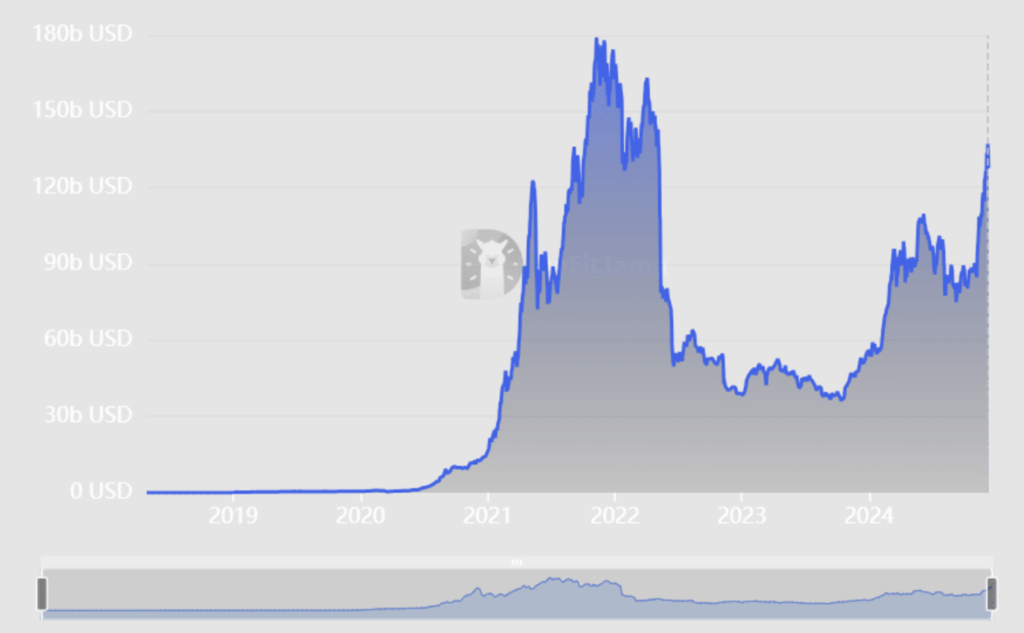
The Total Value Locked (TVL) in decentralized finance (DeFi) surged to approximately $133 billion. This notable resurgence continued throughout 2024, mainly in the third quarter.
While it has since declined to $127.7 billion as of this writing, $133 billion was the closest all-time high of $171 billion, set in 2021, since its descent in 2022.
Which platforms are behind DeFi’s TVL growth?
According to DefiLlama data, liquid staking and lending platforms have played the most significant role in TVL’s increase.
Lido (LDO), a liquid staking platform, currently has the highest value, with $39 billion TVL, almost 30% of the total DeFi value. Next is Aave (AAVE), a lending platform with nearly $22 billion, while Eigenlayer (EIGEN), a staking-focused platform, follows closely with over $18.5 billion.
The rise of these platforms outlines a growing trend among users looking for yield-earning opportunities while maintaining liquidity. Their dominance emphasizes a change in DeFi priorities as platforms providing staking solutions become vital.
Furthermore, Bitcoin (BTC) has – through the quick adoption of its Layer 2 (L2) networks – also played a role in the growth of DeFi’s TVL. This has reflected a growing interest in Bitcoin-based DeFi solutions.
Bitcoin’s TVL recently hit a historic high of over $3.7 billion, reaching above 2% share in the DeFi market. While the figure has slightly reduced to $3.5 billion, it remains dominant.
In addition, the heightened popularity of Bitcoin’s L2 networks, like the Lightning Network, fosters a new wave of DeFi use cases for the coin. This helps Bitcoin (BTC) evolve past its typical role as a store of value and develop more utility use cases.
How do blockchains compare in the DeFi TVL?
The DeFi TVL blockchain breakdown shows Ethereum leading the pack, setting the foundation for the most prominent platforms. The other chains vie for the remaining spots, with almost equal distribution among the following four highest-ranked blockchains.
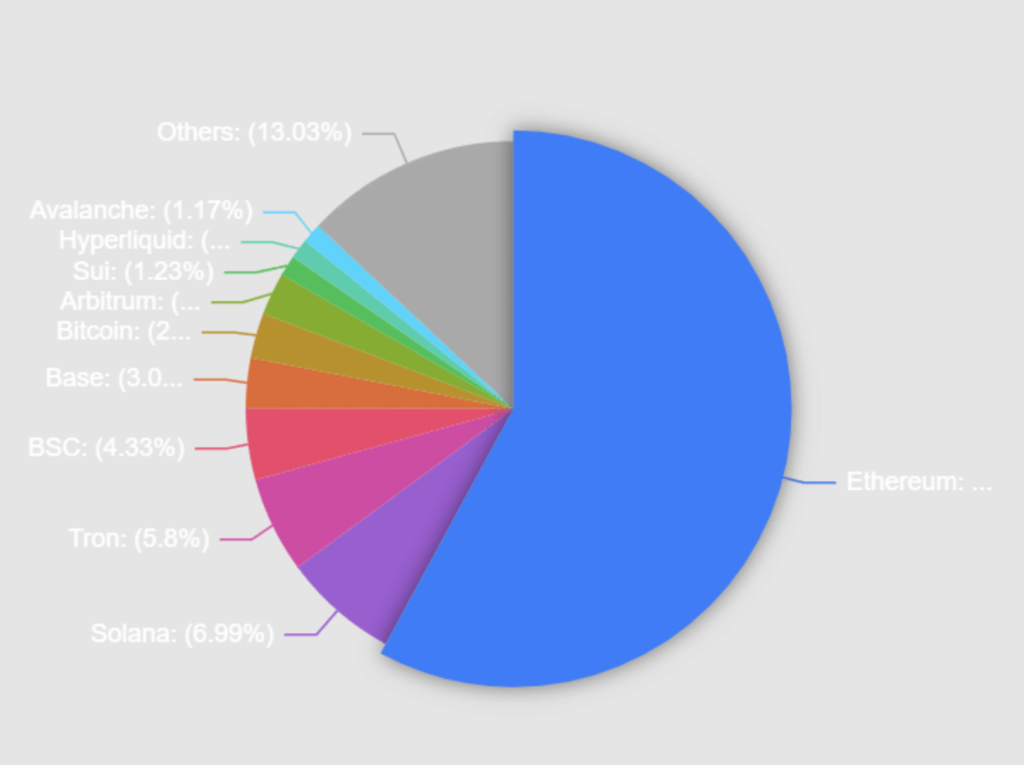
Ethereum accounts for over 58% of the total DeFi TVL, with almost $74 billion locked. It is the go-to blockchain for staking, lending, and trading activities.
The second is Solana, which has almost $9 billion in total TVL and holds 7% of the total TVL. Tron follows closely behind with $7.4 billion, accounting for 5.8%. BNB SmartChain rounds up the top four with 4.33%.
By and large, the recent resurgence in DeFi’s TVL growth points to a maturing ecosystem. The rise of liquid staking, lending platforms, and adoption across blockchains like Ethereum, Solana, and Bitcoin bolsters this. Thus, the future of DeFi is primed for more growth in the future.
Although it is still being determined if the 2021 ATH (all-time high) will be exceeded, the constant momentum presents an optimistic viewpoint for DeFi as it attracts more investors, capital, and consumers.
Closing Remark
First, it is no surprise that crypto investments are surpassing benchmarks set in 2021 today. As expected, Bitcoin (BTC) and Ethereum (ETH)- focused assets lead the way, with altcoins like Ripple (XRP), Cardano (ADA), and Binance (BNB) following closely.
Then, Ethereum’s whale activity increased the weekly surge by more than 300%. For many, that is a statement of intent ahead of Ether’s (ETH) rally to $4,000. Similarly, Ethereum’s Funding Rates also hit 0.03%, indicating bullish sentiment and rising market interest.
Finally, Algorand’s TVL surged to $244.74 million, its second-highest level in history, mainly due to the DeFi protocol Folks Finance. Likewise, the Total Value Locked (TVL) in decentralized finance (DeFi) surged to approximately $133 billion, primarily due to liquid staking and lending platforms like Lido (LDO), Aave (AAVE), and Eigenlayer (EIGEN).
Don’t Miss the Crypto Podcast from Zypto
Zypto co-founder Joe Parkin interviews Michel Wood of AOIZ Network on this crypto podcast episode. They explore the concepts of Web3, dePIN infrastructures for AI, storage, and streaming, as well as their impact on creators, developers, companies, and society.
What are your thoughts on this week’s crypto news? Did any particular development stand out for you? Leave a comment below and let us know your perspective.

FAQs
What are the top blockchains that make up DeFi’s TVL growth?
The top five blockchains behind DeFi TVL’s growth include Ethereum, Solana, Tron, and BNB SmartChain, with 58%, 7%, 5.8%, and 4.33%, respectively.
What was behind Ethereum’s 300% surge?
Ether’s (ETH) weekly volumes increased by more than 300% to $17.15 billion due to whale transactions surpassing $100,000.
How did Algorand’s TVL spike by over 300%?
Algorand’s TVL increase was due to the growth of DeFi protocols, mostly Folks Finance, which witnessed a 289% increase over the past month.
How did Ethereum Funding Rates show bullish sentiments?
According to a CryptoQuant chart, the Ethereum Funding Rates hit 0.03%, indicating bullish sentiment and rising market interest.
What is behind DeFi’s TVL surge to $133 billion?
Liquid staking and lending platforms have played the most significant role in DeFi TVL’s increase. The top three platforms include Lido (LDO), Aave (AAVE), and Eigenlayer (EIGEN).







0 Comments