

This week saw some positive developments for altcoins as we analyzed signals that could ignite the altseason, whales accumulating ETH, and Solana adding many new addresses daily. For Bitcoin, Hash Ribbon data indicated a potential rally.
Let’s dive in.
3 signals that could ignite the altseason
Many tokens outside the top 200 cryptocurrencies enjoyed monumental gains recently. The surge in the less popular altcoins reflected the anticipated altseason and suggested a shift in trader focus toward more speculative assets.
Some of the tokens include BinaryX (BNX), which led to a considerable percentage increase, Pancakeswap (CAKE), and SPX6900 (SPX). These tokens reinforce the idea of an upcoming altseason, during which smaller-cap tokens outperform the larger market.
With this in mind, let us consider these other three trends that could signal the next boom:
Altcoins vs. Bitcoin
BTC Dominance (BTC.D) reflects Bitcoin’s share of the total crypto market. Historical altseasons usually begin after BTC dominance peaks and starts to fall, enabling altcoins to rally.
BTC.D was 60.7% at press time, up from 56.8% last month. Meanwhile, altcoin dominance dropped to 29.3% from 31.3%. If BTC.D drops below 60% and altcoins regain traction, it could indicate the start of an altcoin rally.
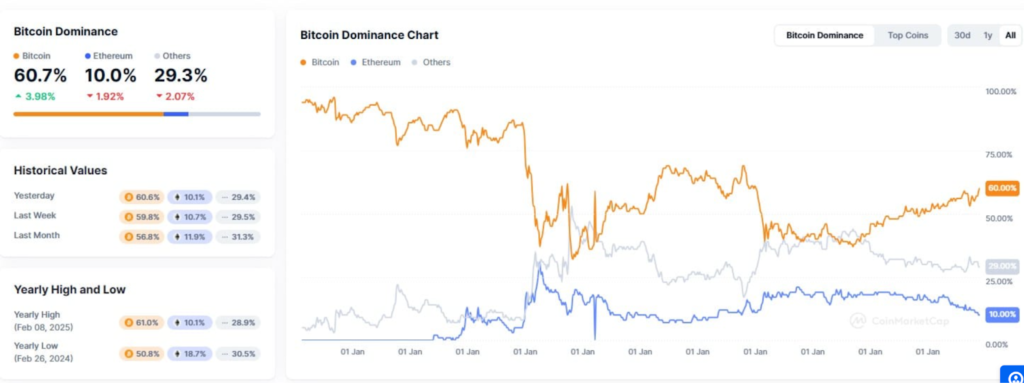
This is because BTC.D often declines during altseason as capital flows into altcoins.
Altcoin market cap as an indicator
The Altcoin Market Cap, estimated at $265 billion, is an essential gauge for alt-season signals. When it rises while Bitcoin declines, it reflects capital rotation into altcoins, indicating increased investor confidence.
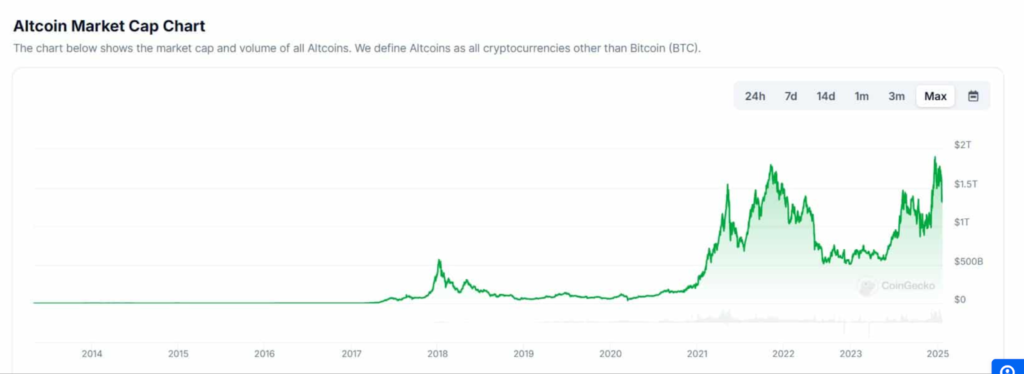
The historical chart displays cyclical spikes in the altcoin market cap, usually aligning with broader market trends. Previous surges led to noteworthy rallies across the altcoin market.
Crypto airdrops & social media hype
Crypto airdrops and increased social media buzz represent a strong indicator of a forthcoming alt-season. During this time, new projects aggressively launch through ICOs, and crypto airdrops become more regular, tempting traders with free token distributions.
Influencers and crypto enthusiasts intensify the hype on X (formerly called Twitter), while Telegram and Discord communities are filled with conversations about the next biggest altcoin.
Whales accumulate ETH after Ethereum’s decline
Ethereum (ETH) recently dipped below $3,000, making it the first time it went below the psychological level since early November 2024. While this drop impacted the value of wallets that purchased ETH above $3,000, it also presented a buying chance for whales and institutions.
First, data from IntoTheBlock showed that whales have been on a buying spree since 4th February. The surge in large holders can depict these netflows from -109,160 ETH to 174,000 ETH within just four days.
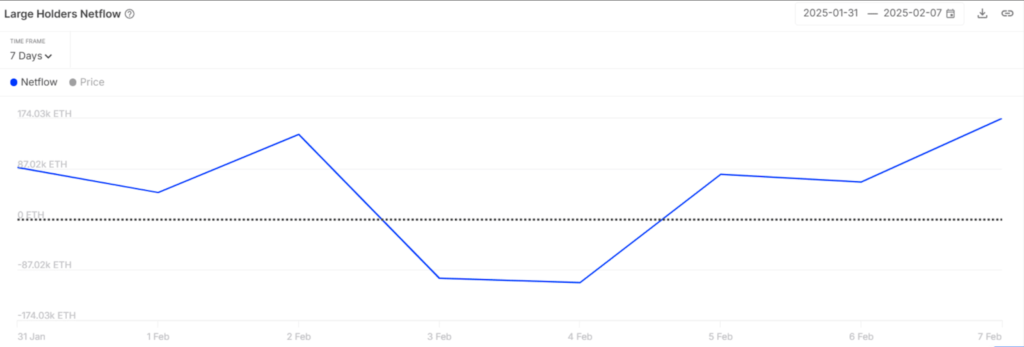
Whales or large addresses accumulate during dips and sell at the top. Thus, the rising inflows may indicate that ETH may have plummeted, paving the way for a recovery.
Similarly, Ethereum whale concentration has slowly grown over the previous year from 37% to 43% at press time. And with whales holding a significant share of Ethereum’s supply, buying activity from this category could increase volatility.
Yet, large addresses aren’t the only category buying the recent dip.
ETH ETF inflows reach 2025 highs
Institutions also appear to be accumulating funds after weekly inflows to Spot Ethereum exchange-traded funds (ETFs) surged to a 2025 high. According to SoSoValue data, the weekly inflows to Spot Ethereum ETFs have increased to $420M. These inflows also became the fifth-highest level for Ethereum ETFs since the products started trading in July 2024.
These figures indicate that Ethereum’s decline below $3,000 also led to demand from institutions, implying that they remain bullish about the altcoin’s long-term performance.
Then, the In Out of the Money Around Price (IOMAP) metric emphasized a key demand zone below Ethereum’s press-time price. This demand zone lay between $2,382 and $2,459, and 2.21 million addresses purchased ETH in this zone.
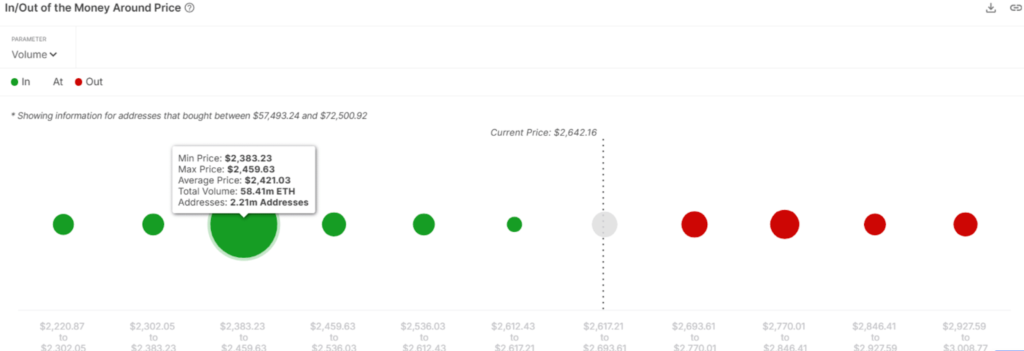
The high profitability of addresses that bought ETH in this zone could make it an ideal entry point for buyers and serve as support. If ETH drops to retest this demand zone and verifies buyer strength, it could trigger a price recovery.
Yet, despite the rising interest from whales and institutions, network activity on the Ethereum mainnet has declined. Ethereum’s gas fees recently plunged to a 2025 low, pointing to consolidated network usage. Such a decline could fail to portend well for ETH’s future price performances.
So, what is it looking like?
Ethereum’s market sentiment analysis
Ethereum has experienced intense downward pressure since reaching a local high of $3.4k. After the market crash, which caused the altcoin to drop to $2.1k, it has been unable to reclaim a higher resistance level.
As of this writing, Ethereum has dropped 16.51% and 19.11% on weekly and monthly charts, respectively. Due to the recent price drop, vital stakeholders have expressed optimistic and pessimistic views of ETH.
Popular crypto analyst Ali Martinez suggested that Ethereum is preparing for an essential upward move. According to them, the dominant conditions positions ETH for a possible breakout above $4,000.
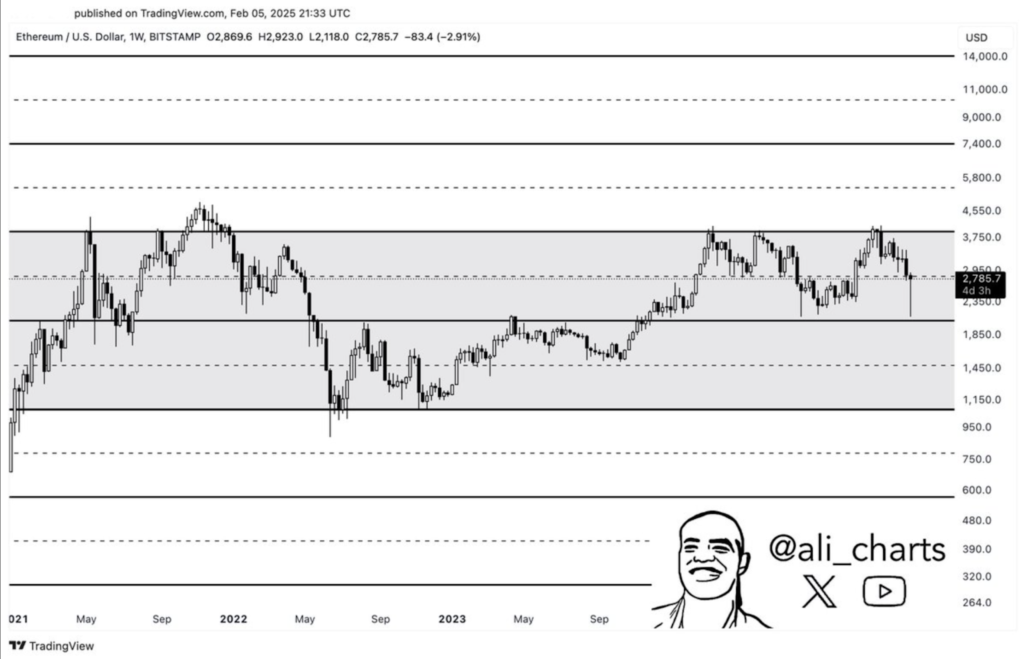
This analysis shows that if the altcoin breaches the resistance, it will pave the way for a parabolic rally. Thus, ETH could rally toward $7.4k, $10k, and a historical $14k. Yet, it is essential to note that these levels are long-term and unlikely to occur in the short term.
Ethereum also experienced robust downward pressure, mainly in the short term. For example, its Sharpe Ratio (90 days) has been dwindling, hitting negative territory.
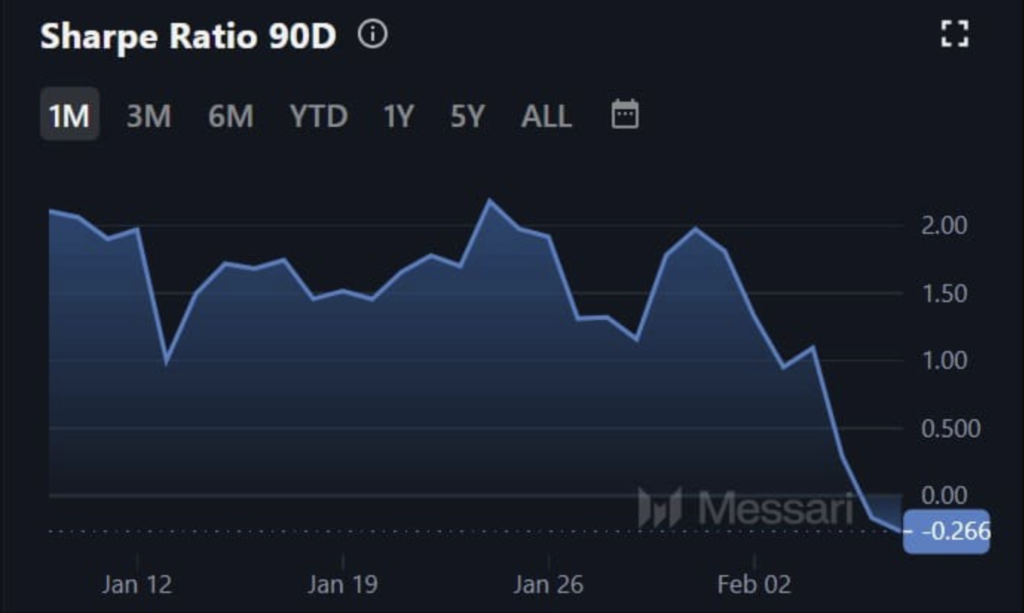
At press time, this metric was at -0.266. Such a sustained decline implies a risk-adjusted return over the past 90 days is worse than a risk-free asset. Therefore, ETH does not pay traders for the risks it takes, thus making the crypto less attractive to investors.
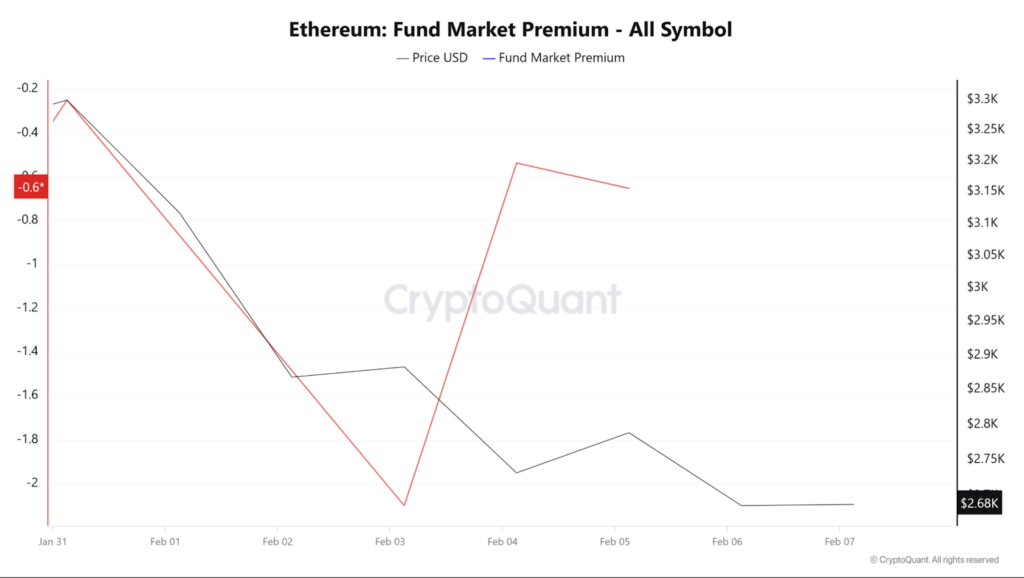
In addition, Ethereum is experiencing strong bearish sentiment, as seen by a negative Fund market premium. This premium has remained negative throughout the week, which means that most investors are taking short positions and anticipate prices reducing.
Whales have turned bearish as they increase their deposits into exchanges. The large holders’ netflow to exchange netflow ratio has risen to 14.09% from -23.91. As more large holders transfer their assets to exchanges, more selling pressure builds, further driving prices down.
With the current conditions, ETH may breach its critical support of $2.7k at this rate, which could drop to $2500. Regardless, a trend reversal will see the premier altcoin reclaim $2710 and attempt a run to $3,000.
Hash Ribbon data signal at a possible BTC rally
Bitcoin (BTC) miners hint at a market shift, as the Hash Ribbon indicator infers the end of miner capitulation – when miners encounter financial stress and shut off equipment. Typically, this has preceded significant Bitcoin price moves, marking a departure from miner stress to recovery.
The Hash Ribbon indicator evaluates Bitcoin miners’ health by analyzing the network’s 30-day and 60-day Moving Averages (MA) hash rate. When the 30-day MA drops below the 60-day MA, it signals miner capitulation.
Conversely, recovery occurs when the 30-day average reclaims the 60-day average, historically indicating improved miner conditions and possible price rallies.
Now, the Hash Ribbon indicator approaches a recovery signal as the data underscores the 30-day MA of the hash rate converging with the 60-day average. This pattern historically led to the end of market capitulation.
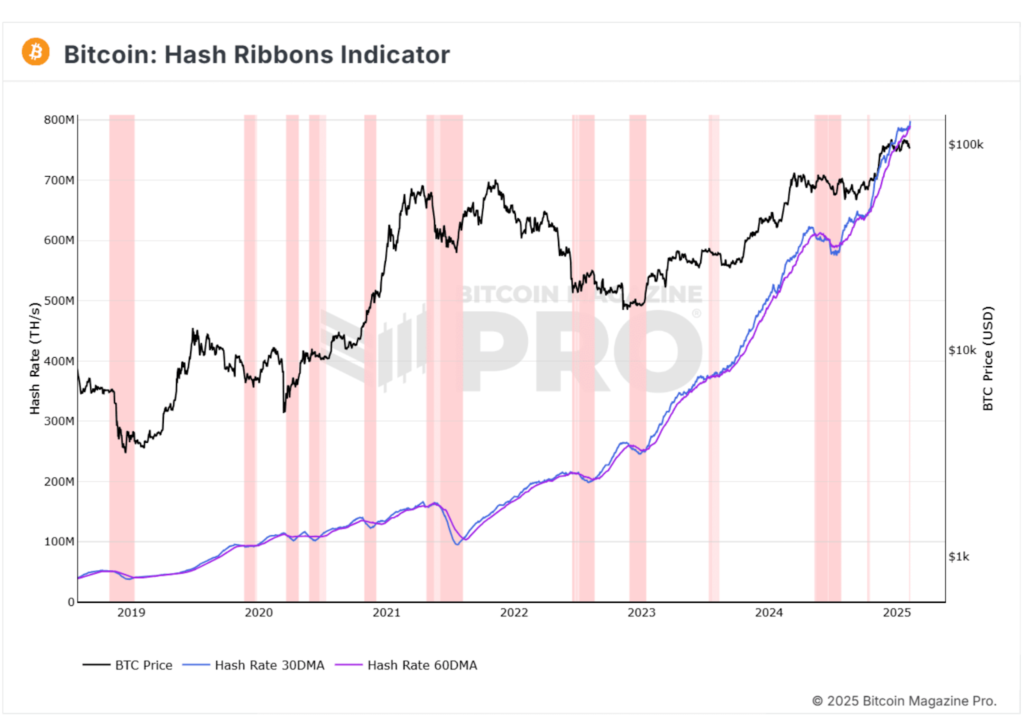
If the recovery phase emerges, BTC could exceed its current $100,000 level, which is led by miner resilience and rekindled investor confidence. Yet, other factors like trading volume and retail interest, amongst others, must align to sustain upward momentum.
Nevertheless, this analyst cautions against relying on just one indicator. Market conditions 2025 differ from previous cycles, with higher institutional involvement and tighter liquidity. Thus, a multi-metric approach is advised.
Over the past week, BTC has continued to trade sideways. It has made substantial gains on weekly and monthly charts, increasing by 2.81% and 2.89%, respectively. This has led to questions about what factors are behind it.
Bitcoin’s Leverage Ratio reduces
An analyst has noted that BTC is enjoying higher institutional demand and long-term accumulation due to a decreasing Leverage Ratio. Typically, a lower Leverage Ratio reduces the risk of liquidation, thus making price action more organic than derivatives-driven.
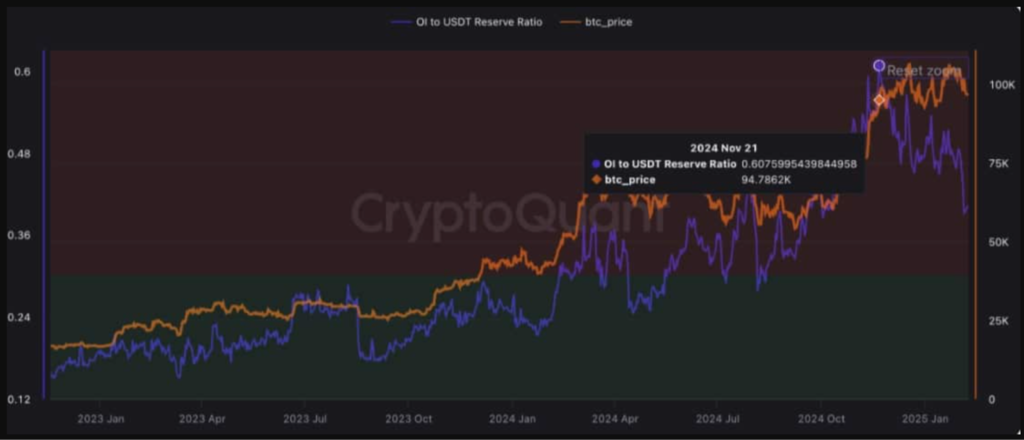
Since November 21, Bitcoin’s leverage ratio has declined, so open interest (OI) has declined relative to available BTC on centralized exchanges (CEXs). CEX reserves have also witnessed a sustained decline, during which BTC has moved to Coinbase Prime while buying Bitcoin ETFs.
When CEX reserves drop, it suggests that less BTC is available to sell. The rise in flow to Coinbase indicates that large players, mostly institutions, are accumulating. All this market behavior implies that Bitcoin is currently experiencing a healthy market. Prices are not driven by leverage, making future rallies more continuous.
What does this mean for BTC?
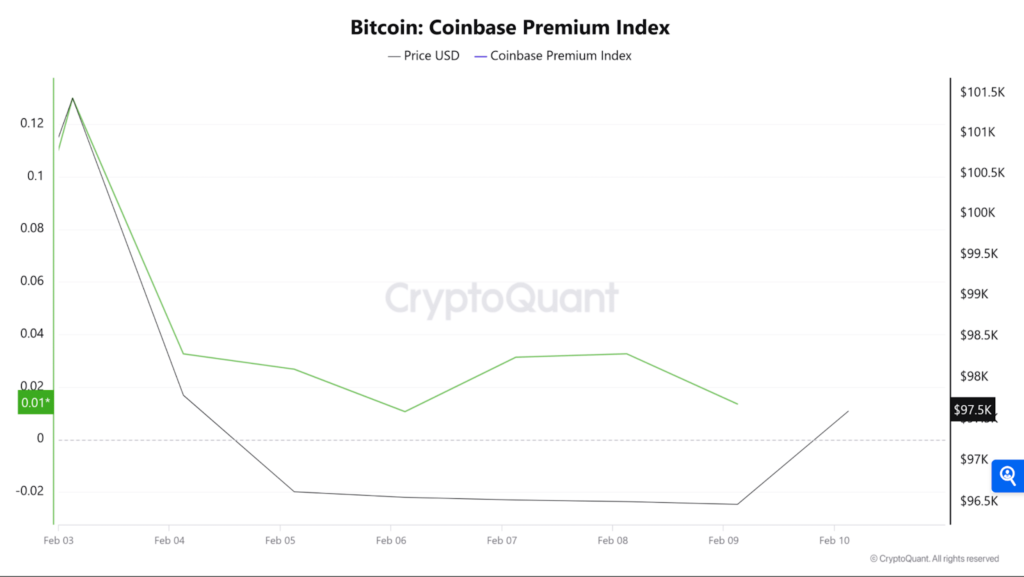
With spot demand increasing with less leverage while institutions actively accumulate, markets are experiencing strong bullish sentiment. For example, Bitcoin’s Coinbase premium index has remained positive throughout the past week. This suggests positive sentiments among U.S. investors and increases demand from institutions.
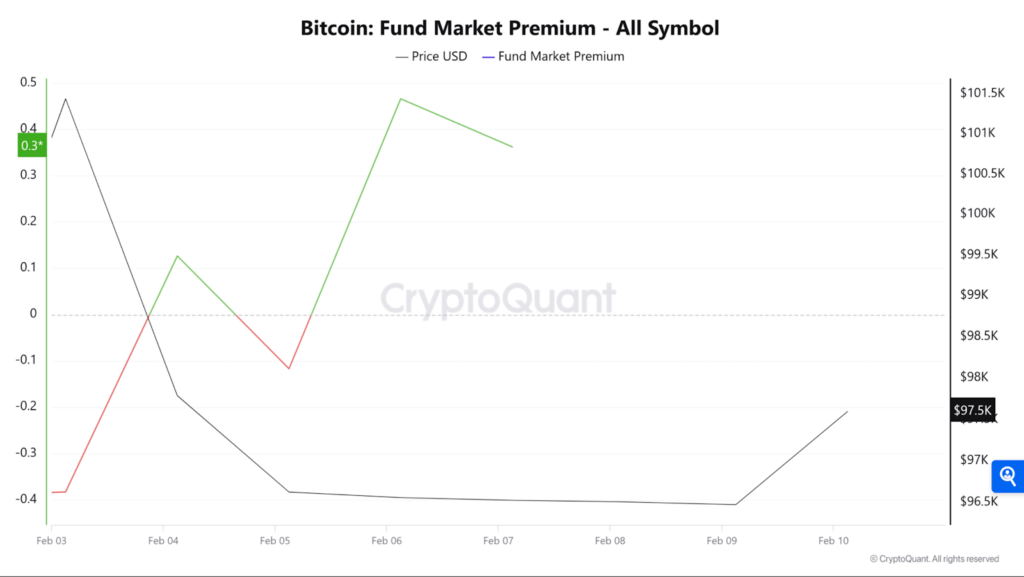
In addition, Bitcoin’s Fund Market Premium has increased and turned positive over the past day. When it turns positive, investors are bullish, with longs playing shorts to hold their positions – as they expect prices to rise soon.
Lastly, market participants keep accumulating, with outflows surpassing inflows. Exchange netflow has reduced to -2.9k, showing more exchange withdrawals as investors accumulate. BTC is seeing bullish momentum strengthen as retail and large holders accumulate.
This behavior suggests that BTC markets have cooled off, setting up the crypto for more gains. If this sentiment holds, BTC will reclaim $98,127 in the short term and attempt a breakout to $100k, or a pullback will see BTC decline to $95,800.
Having been stuck within a consolidation range over the past week without maintaining upward momentum, an analyst has predicted a critical point for BTC short-term holders (STHs).
Why $96k is vital for BTC to remain bullish
The analysis showed that Bitcoin’s realized price for the 1-3 month cohort was $96k. Historically, when BTC declines to this level after an uptrend, it acts as critical support, implying that STHs are assured of their positions despite the surging prices.
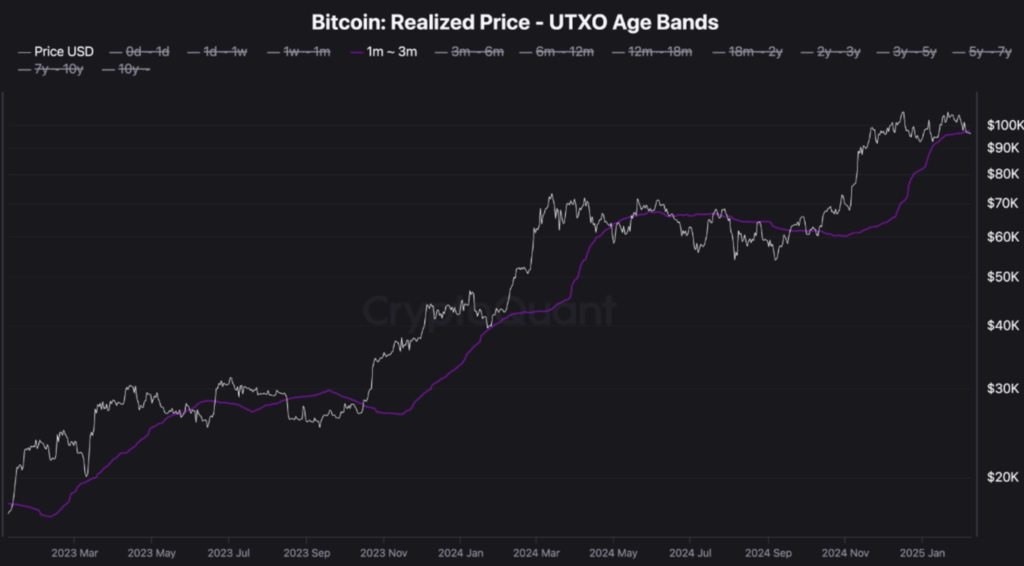
Holding above this key level is crucial as it reinforces bullish market sentiment, thus increasing the probability of an extended upward trend. Alternatively, if BTC fails to hold this support at this critical threshold and breaks below, it could cause a shift in sentiment, leading to a distribution phase.
Thus, the next move around this point will be vital in shaping BTC’s short—to medium-term trajectory.
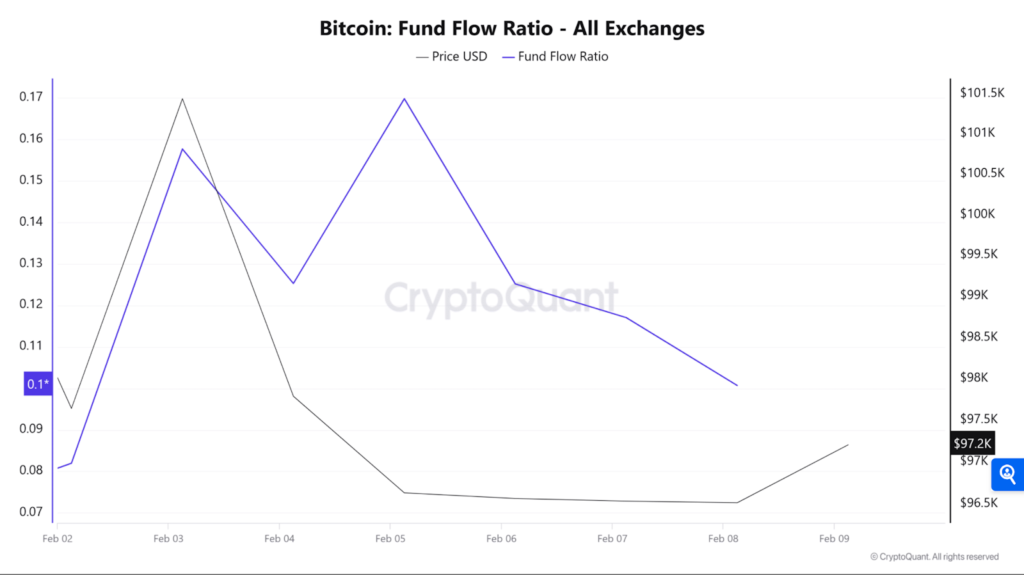
Bitcoin’s Fund Flow Ratio has declined for three consecutive days, implying that a smaller portion of BTC transactions involve exchanges. This trend signals that investors hold their assets rather than sell, which often aligns with the accumulation phase before prices rise.
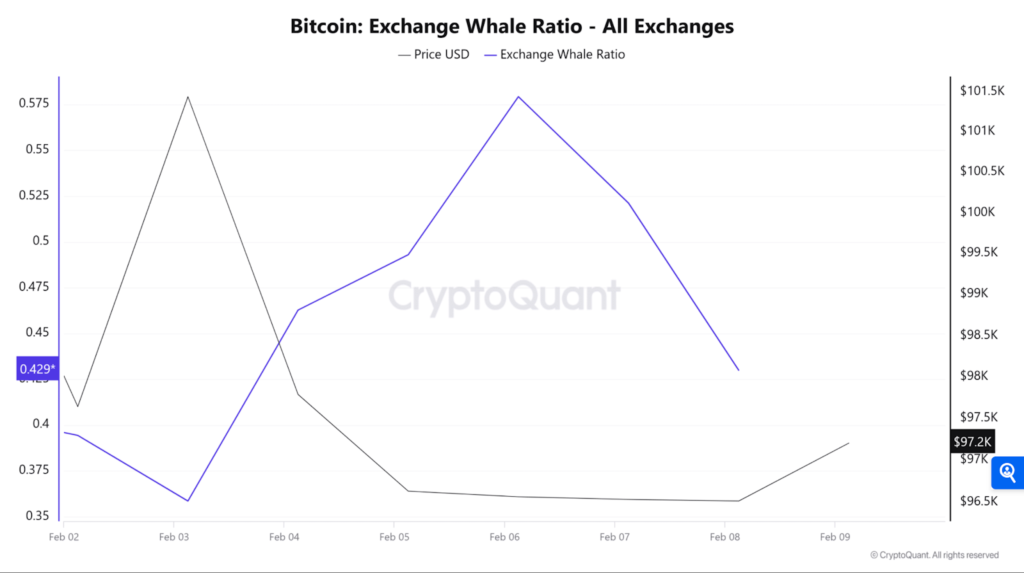
This accumulation also seems strong among whales, as confirmed by the declining Exchange Whale Ratio which plummeted over the past three days. Such a decline indicated that whales continued to hold BTC as they anticipated further price gains.
Although BTC has struggled to hold above $96k, the crypto still has room for growth. With more gains, STHs’ belief will be strengthened, further backing bullish sentiments.
With investors still optimistic, BTC could attempt $98,000 and then face $100k resistance. However, if it fails to hold above this level, BTC could drop to $94k, risking additional decline.
Solana creates 5 million daily new addresses
According to Glassnode data, Solana has been growing, with over 5 million new addresses created daily. The blockchain has also experienced impressive network growth and market momentum, surging by 4.4% within 24 hours.

This increase in new addresses emphasized the growing adoption of the Solana network, revealing a positive outlook for the token. More users on the network lead to higher demand for SOL, putting upward pressure on its price. These factors reinforce the bullish sentiment for SOL.
Solana traders grow bullish
First, the Long/Short Ratio chart shows an apparent increase in long positions for SOL, indicating a growing bullish sentiment among traders. This shift towards more long positions reflects a belief in SOL’s continued price growth.
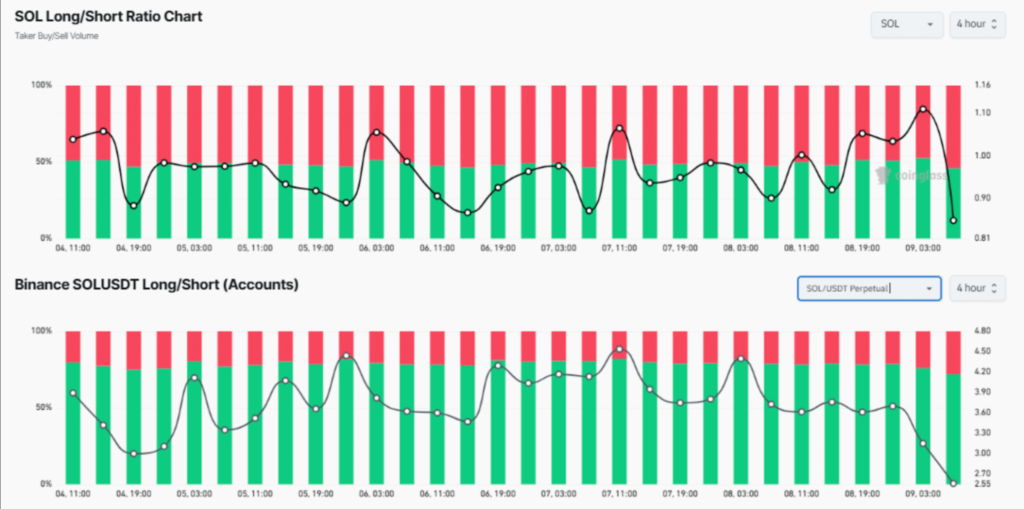
Increasing long positions often increase buying pressure, further advancing SOL’s price. This trend supports the broader market sentiment that SOL’s price may continue to rise since more traders seem to enter the market with a positive outlook.
Secondly, the spot Inflow/Outflow indicated that exchanges witnessed a significant outflow of $60 million worth of SOL, suggesting potential accumulation that could create buying pressure and push a price rally.
This considerable outflow also inferred that long-term holders were capitalizing on the current market sentiment to accumulate the token and leverage the price drop.
Similarly, Binance traders were aggressive, with most taking long positions. At press time, Binance’s SOL/USDT Long/Short Ratio was 3.35, suggesting a strong bullish sentiment among traders.
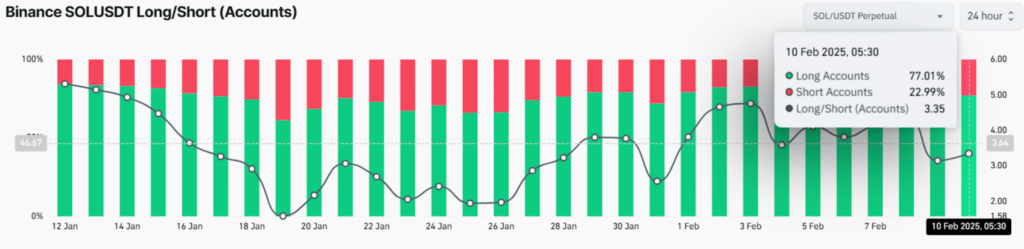
At press time, about 77% of top SOL traders on Binance took long positions, while 23% held short positions. When traders and investors show interest in a token, exceptional results often result.
What is Solana’s future path like?
Open Interest has increased generally, primarily due to recent price movements. As the price of SOL has been trending upward, the rise in Open Interest indicates that new capital is flowing into the market. Moreover, the increase shows that the market isn’t driven by speculative interest but by real investments, which helps support price growth.
Consequently, this pattern and network growth indicate that SOL’s ecosystem is developing. Thus, more investors will commit to long positions as the price keeps climbing.
Solana’s outstanding network growth, alongside bullish price action, signals that SOL is on a strong upward trajectory. Therefore, the patterns between network growth and market metrics show that SOL’s price will continue to profit as the network grows.
Furthermore, Solana’s stablecoin supply surged to $12 billion, increasing liquidity. Even with the market’s volatility, SOL has been in good standing. Due to increased trading volume, traders bought the dip at $188, pushing the price up 8%.
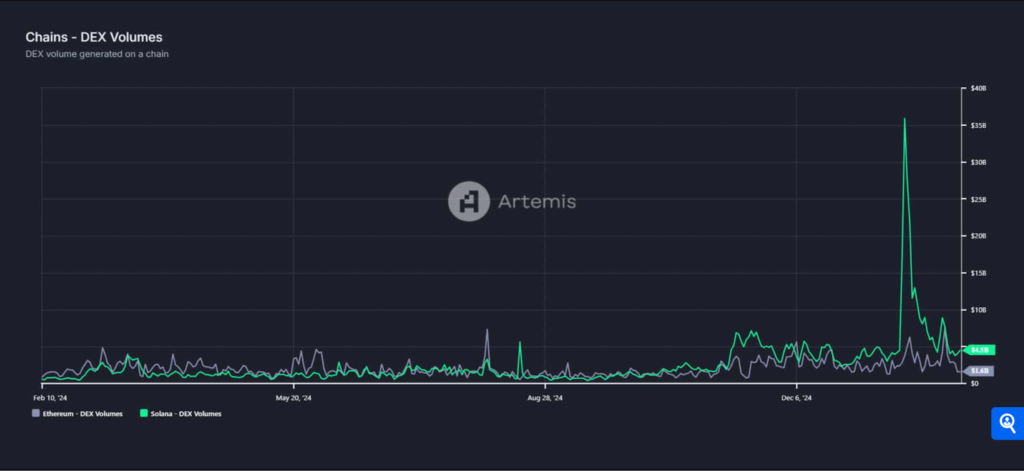
Still, Solana surpassed Ethereum in DEX volume despite SOL’s monumental descent from its $40 billion all-time high to $4.5 billion. The SOL/BTC chart showed bullish signs as investors moved into high-caps to hedge against Bitcoin (BTC).
Closing Remark
With lesser-known altcoins enjoying price surges, these tokens reinforce the idea of an upcoming altseason. More so, with some of the altseason signals in full flight, time will tell.
Although Ethereum declined below $3,000, it led to institutional demand and whale accumulation. This implies that they remain bullish about the altcoin’s long-term performance. The Hash Ribbon indicator has historically preceded significant Bitcoin price moves, so fingers crossed.
Finally, the increase in Solana’s new addresses emphasized the growing adoption of its network, revealing a positive outlook for the token.
Zypto Promo
Zypto App 1.10 has just released, bringing one of the most highly awaited features – the Pay Bills With Crypto service now available in-app. Supporting 10 countries with more on the way, including the US, Mexico, the Philippines, India, Pakistan, Malaysia, Egypt, Costa Rica, Honduras and Guatemala, Zypto makes paying bills with crypto quick and easy all over the world. Find out more here.
What are your thoughts on this week’s crypto news? Did any particular development stand out for you? Leave a comment below and let us know your perspective.

FAQs
Why did whales accumulate ETH during its price drop?
Whales or large addresses accumulate during dips and sell at the top, as it benefits them more financially.
What are the three signals that could ignite the altseason?
They include a drop in BTC Dominance (BTC.D), a surge in Altcoin Market Cap, multiple crypto airdrops, and increased social media buzz in the crypto ecosystem.
What is Ethereum’s market sentiment like?
An analyst suggested that Ethereum is preparing for an upward move. Conversely, a negative Fund premium implied that most investors are taking short positions and anticipate prices to reduce.
How does Hash Ribbon data signal at a possible BTC rally?
Hash Ribbon indicator infers the end of miner capitulation, which historically preceded significant Bitcoin price moves.
What does Solana’s increase in address mean?
This increase in new addresses emphasized the growing adoption of the Solana network, revealing a positive outlook for the token.


0 Comments